Geology Reference
In-Depth Information
view west
c
s
a
β
detachment
Himalayan
foreland
Modeled and Observed
Himalayan Topography
Fig. 11.21
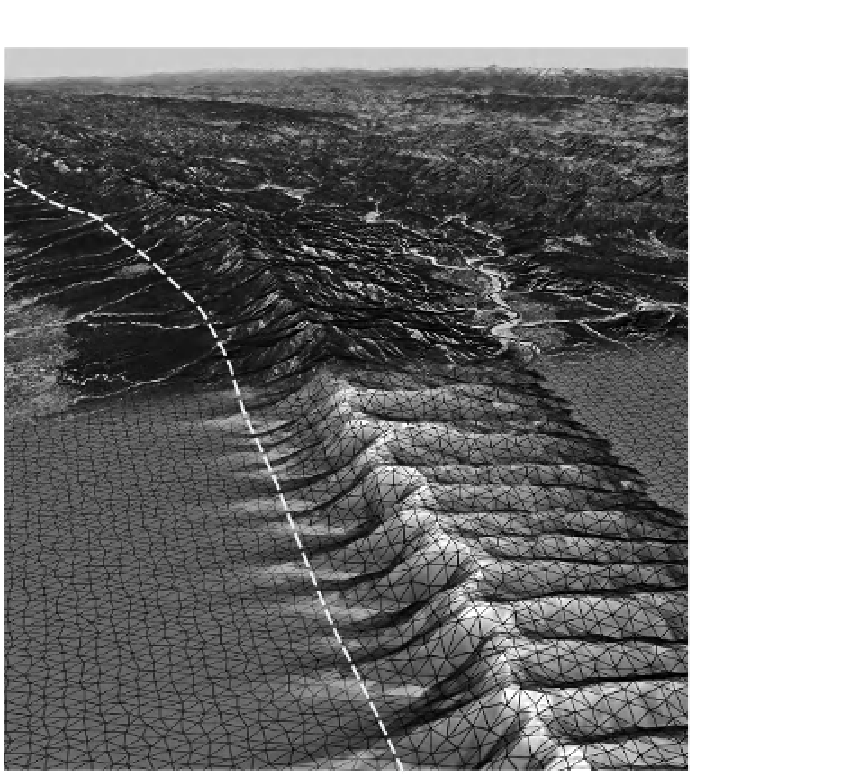
CHILD model of a thrust-generated mountain range.
Satellite imagery draped over digital topography (top part of image) of the Siwalik Hills, western Nepal, compared
with a numerical landscape evolution model (bottom part) of a mountain range formed in the hanging wall of an
emergent thrust fault. One can see the Voronoi mesh employed in the CHILD model. Scale varies in this perspective.
In this region, the Siwalik Hills and the model mountain range are both
∼
13 km wide and
∼
1300 m in total relief. The
model topography shown forms above a planar fault ramp dipping 30
°
to the right (see inset), a 5-km-thick hanging
wall, a 20 mm/yr fault-slip rate, and a stream-power coefficient,
K
, equal to 2 × 10
−5
yr
−1
. Exponents
m
and
n
in the
stream-power equation are 0.5 and 1, respectively. Himalayan images from Google Earth (copyrights 2005 Google, 2005
EarthSat, and 2005 DigitalGlobe). Figure courtesy of Scott Miller. [A color version of this appears as Plate 9.]
atmosphere with topography, only recently
have we developed models to acknowledge these
interactions in a quantitative fashion. The most
important of these interactions is what we broadly
term “orographic effects” or “orography,” the role
of mountains in governing the pattern of precipi-
tation. The last decade has seen advances in our
ability both to observe meteorological events and
to model them. We begin with the observations.
Weather stations are simply too sparse to
document precipitation patterns at the spatial
density we require. Happily, observation platforms
in the form of satellites have come to the rescue
in documenting precipitation patterns. In
particular, one can extract from the TRMM
(Tropical Rainfall Measurement Mission) satellite
data stream spectacular products (some with
spatial resolution of
5 km) that reveal both
spatial and temporal patterns of precipitation in
mid- to low-latitude regions of the world. For
example, Bookhagen and Burbank (2006, 2010)
have shown that the precipitation pattern in the
Himalaya displays orographic effects (Fig. 10.32)
that help to explain the water discharge patterns
(hydrographs) of the major rivers draining the
range (Fig. 11.22 and Plate 10).
∼