Geology Reference
In-Depth Information
an excellent review of the literature of landscape
evolution models, including discussion of the
history of modeling, the model ingredients (or
rules), and a list of recently developed models.
Early attempts involved one-dimensional models
of the evolution of simple ranges bounded by a
single fault. These studies included a uniform-
slip dislocation model of a single planar fault,
diffusion of resulting topography, and flexural
compensation for the rearrangement of rock
mass. In a pair of prescient papers (King
et al
.,
1988; Stein
et al
., 1988), these authors both
developed the fundamental principles behind
such linked models (Fig. 4.30), and applied them
to specific settings in the American West. They
explored both normal- and thrust-faulted ranges.
Importantly, they found that the flexural rigidity
of the crust played importantly into setting the
width of the zone over which the sediments
eroded from the rising mountain mass were
spread (Fig. 11.15). For example, they argue for a
very low rigidity in the Basin and Range province
(e.g., effective elastic thicknesses of only a few
kilometers - see Fig. 11.4) in order to match the
very narrow depositional basins near the active
faults. The simplicity of the models, being one-
dimensional with only three major components,
allowed efficient exploration of the roles of each
of the processes in the problem. Note, however,
that the entirety of the geomorphic suite of
processes is boiled down into a single diffusion
coefficient. No channels exist. No weathering
exists. None of the complex feedbacks between
these processes are allowed. Nonetheless, much
insight was gained through this suite of models.
Was it necessary to incorporate these other
processes? Was it worth the effort of moving to
two dimensions, as is necessary if attempting to
distinguish channels and hillslopes? At the same
time, models along these lines were also being
constructed of thrust-faulted settings, with more
attention being paid to the stratigraphic package
A
Roan Plateau
Knickpoints
Knickpoints
39.7
B
30
optimal
initia
t
ion
time:
~35
0
ka
20
10
0
39.6
0
400
800
Time (ka)
39.5
Knickpoints
Observed
Modeled
108.2
108.1
108
107.9
Longitude West
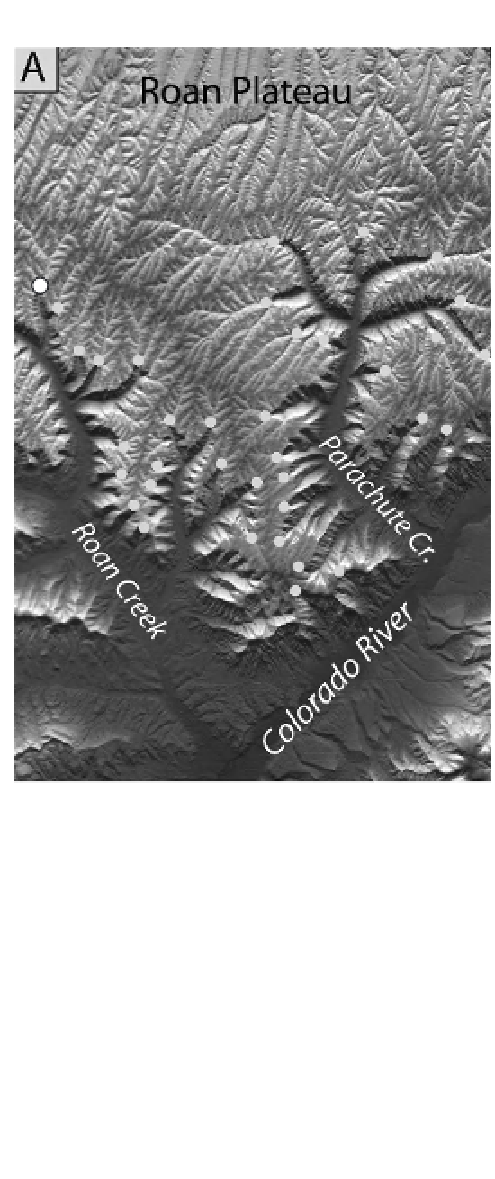
Fig. 11.14
Knickpoints on the Roan Plateau.
A. Map of Parachute and Roan Creeks, Roan Plateau,
Colorado, showing modern locations of knickpoints.
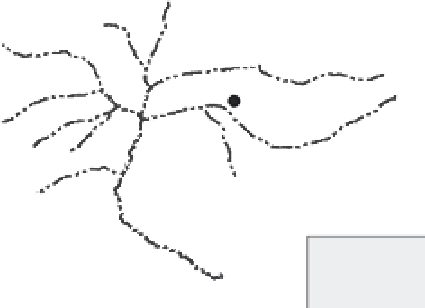
B. Results of 350-kyr celerity model of knickpoint
migration in Parachute Creek, showing present positions
of knickpoints (black dots) and locations of model
knickpoints at 20 time increments (open circles). Most
knickpoints are well fit with this simple model. (Inset)
Goodness of fit measured by sum of misfits of knickpoint
locations, as a function of simulation time. Best fit is
350 kyr for the given choice of
k
= 5 × 10
−10
m
−1
yr
−1
, and a
critical upstream area of 0.5 km
2
. Whereas the value of
k
directly scales with the assumed time of initiation of the
base-level fall event, the value of
p
is robust. Modified
after Berlin and Anderson (2007).