Geology Reference
In-Depth Information
A
Slope / relief histogram
polygons
0123 km
A
Slope / relief histogram
polygons
0
123
km
A
A
A
forelimb
30-m DEM of
Wheeler Ridge
B
B
C
backlimb
D
E
E
F
F
B
0.15
Slope
Distributions
Polygon Mean
Polygon Mean
0.1
E
D
E
F
(12°)
(9°)
(3°)
A
B
C
(19°)
(18°)
(6°)
F
D
B
A
A
0.05
backlimb
forelimb
C
D
0.0
0
0
10
20
10
20
30
40
Slope (°)
C
0.3
Relief Distributions
Polygon Mean
0.25
Polygon Mean
A
B
C
D
E
F
(38 m)
(25 m)
(7 m)
(56 m)
(51m)
(16 m)
0.2
0.15
F
E
D
D
forelimb
backlimb
A
0.1
A
C
B
0.05
0.0
0
60
80 0
60
80
100
120
20
40
20
40
Relief (m)
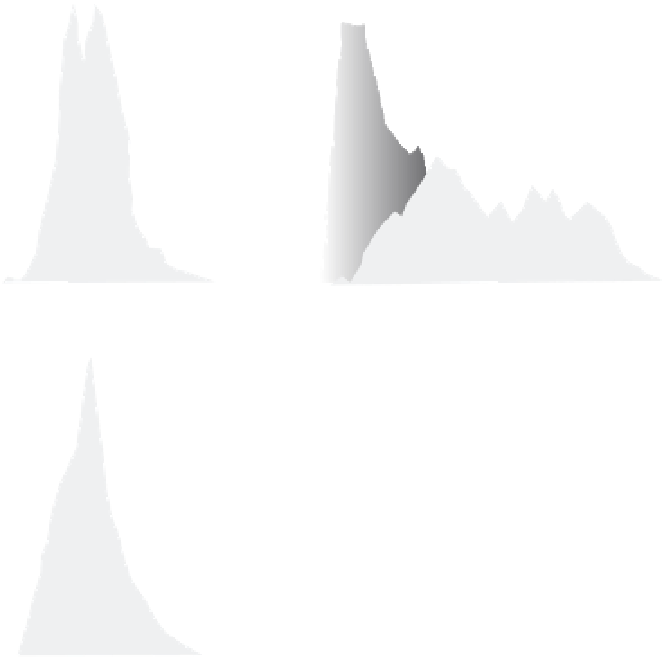
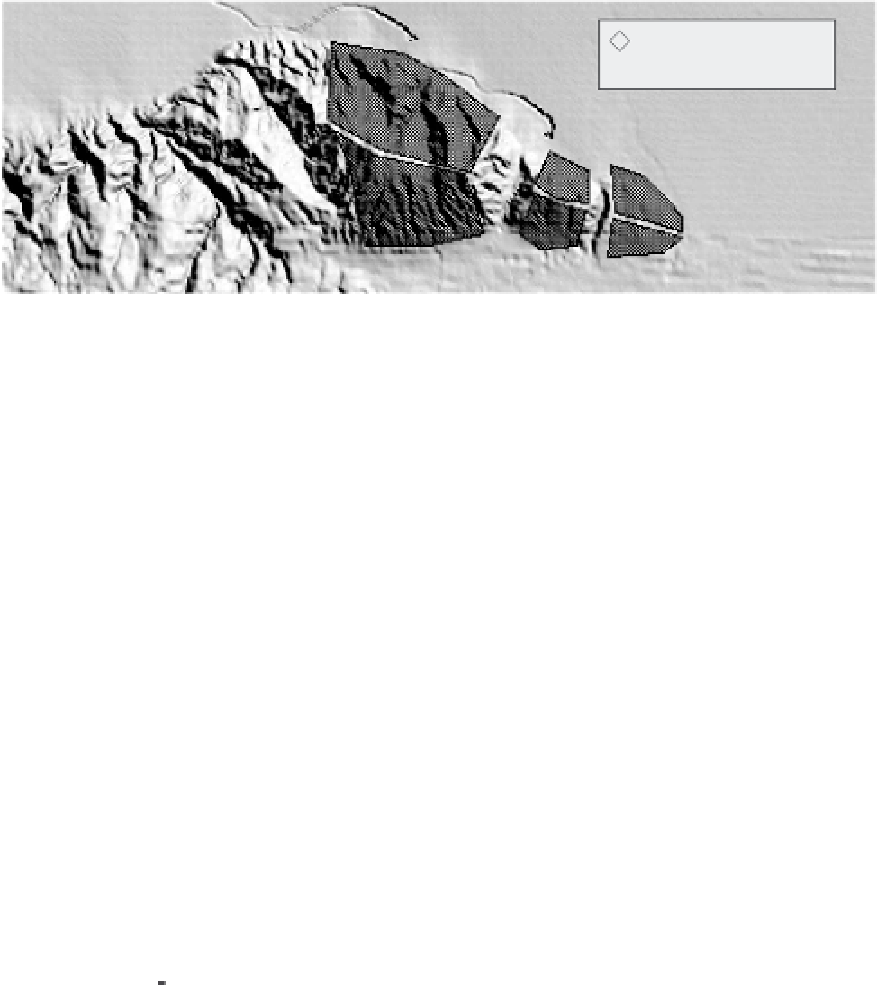
Fig. 9.26
Wheeler Ridge geomorphology.
A. Polygonal areas represent calculation areas on either flank of the Wheeler Ridge anticline. Magnitude of rock uplift
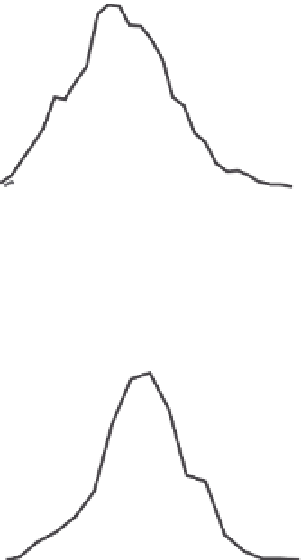
and dissection increase toward the west. B. Slope distributions (150 × 150 m window) for polygons shown above. Note
progressive changes from old (A) to young (C) and the persistent difference between the forelimb (A-C) and backlimb
(D-F). C. Relief distributions for the same polygons. Modified after Brozovic
et al.
(1995).
has occurred near the eastern nose of the fold.
The magnitude of erosion (eroded volume/
source-area size) is always higher on the fore-
limb rather than the backlimb (Fig. 9.27A); this
contrast supports the concept of erosion rates
being slope dependent. The rates are also higher
on the older parts of the fold, where greater
relief is present and more time for dissection has
elapsed (Fig. 9.26). A plot of the rates of dissec-
tion versus the mean slope (Fig. 9.27A) shows