Geology Reference
In-Depth Information
Fold Models
Channel Proiles Through Time
Normalized Channel Incision
300
T5
Old
Limb lengthens
at fold toe
Mature
Initial
Lengthening
through crest
1
T4
0.3
200
T3
T2
0.2
100
Young
Limb lengthens
at fold toe
Lengthening
through toe
T1
Channel
Surface
0.1
0
0
1000
2000
3000
0
0.5
1
300
T5
Old
1
Initial
Mature
T4
Limb lengthens
at fold crest
200
Limb lengthens
at fold crest
T3
T2
100
T1
Distance (m)
Y
0
0
0
0.5
1
500
1000
1500
2000
Longitudinal Channel Proiles
0
1
Old
Mature
Initial
200
T5
Lengthening:
at toe
T4
Limb
rotation
at crest
T3
T2
Limb
rotation
T1
Rotation
Young
0
0
0
500
1000
1500
0
0.5
1
Distance (m)
Normalized Distance
Normalized Distance
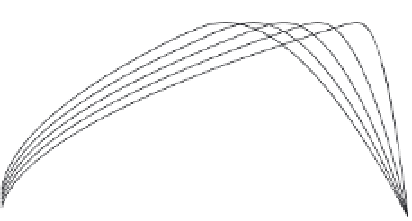
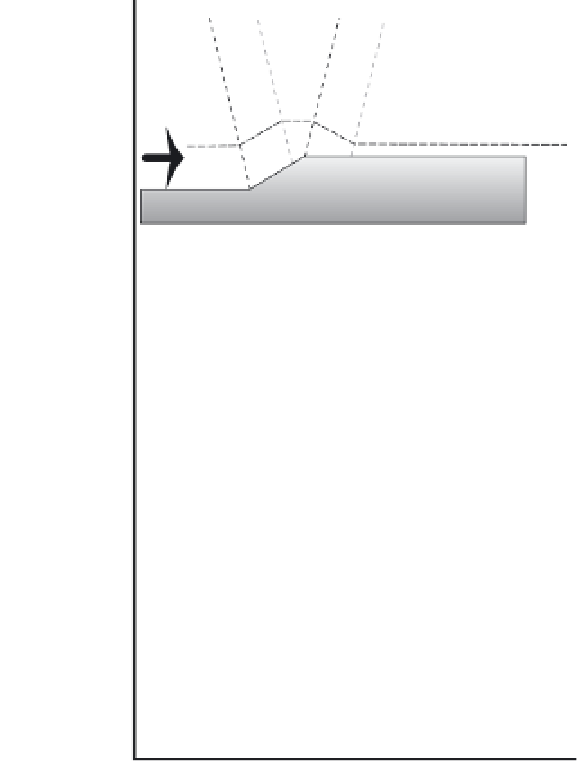
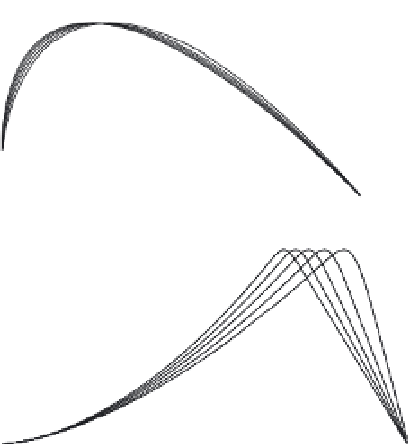
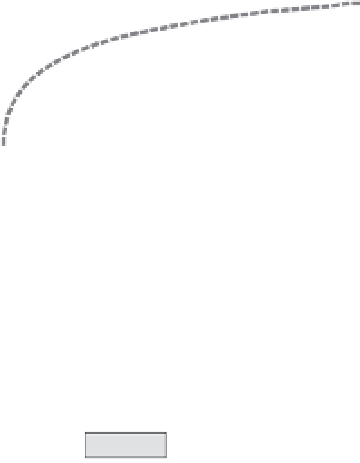
Fig. 9.18
Channel profiles on fold limbs for different fold models.
(Left, top) Different modes of limb growth: lengthening through the toe or crest at a constant angle, or rotation of a limb of constant length. (Center) River
incision patterns through five time steps for different fold models. Both the pristine fold surface and the channel profile are depicted for each step. (Right)
Spatial patterns of incision below an undissected surface for five time steps (as in part B). Note the migration of the point of deepest incision through time
(arrows). Top figure also shows the instantaneous incision rate versus distance (dashed line). (Left, bottom) Normalized long profiles for each fold model at
time step 5. Note the strong contrasts in concavity and overall shape. Modified after Goode and Burbank (2011).