Geology Reference
In-Depth Information
240
Steady Uplift
Rate
9
160
7
80
rate
5e
5c
5a
0
ec
a
5
rock
uplift
3 2 1
-80
9
8
7
isotope
stages
sea
level
-160
300
200
100
0
A
Age (ka)
400
Unsteady Uplift
Rate
ii.
0.4 m/ka
(r
2
=0.99)
Altitude (m)
300
350
300
250
200
150
100
50
0
-50
-100
-150
i.
200
1.2 m/ka
(r
2
=0.98)
Pleistocene
terraces
rate
changes
?
3.4 m/ka
(r
2
=0.98)
100
0
Holocene
terraces
0
100
200
300
400
Time before present (ka)
sea
level
0
300
600
900
1200 1500
?
Distance (m)
?
rate
changes
?
?
?
?
B
0
80
160
240
320
Time before present (ka)
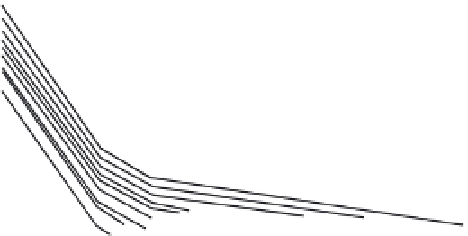
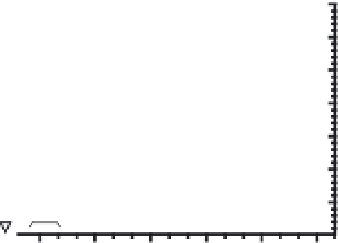
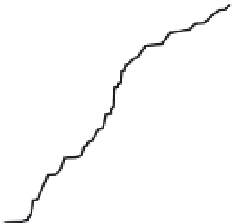
Fig. 9.4
Correlation of sea-level curve with uplifted marine terraces.
A. Graphical correlation of sea-level variations with coastal terrace record based on a steady rock-uplift rate. Note
that not all highstands older than 130 ka or younger than 50 ka are represented in the terrace record. Some older
ones are obscured by subsequent higher sea levels, whereas some younger ones are still below sea level. Modified
after Lajoie (1986). B. i. Example of terrace correlation in northern California based on the assumption of abrupt
accelerations in the rate of uplift. This coastal area has been strongly affected by the passage of the Mendocino triple
junction during the past 100 kyr, such that accelerated uplift is not unreasonable. ii. In order to correlate each of the
observed terraces with a sea-level highstand, the Middle Pleistocene rate of bedrock uplift is inferred to have tripled
at
∼
100 ka and then to have tripled again at
∼
60 ka. Modified after Merritts and Bull (1989).
changes should be offered for this variation.
One observation that could support an assumed
acceleration in the rate of uplift would be the
presence of older, higher terraces that are more
closely vertically spaced than younger, lower
terraces (Fig. 9.4B). Given the nature of the
sea-level curve in which the frequency of high
sea-level stands appears lower prior to 125 ka,