Geology Reference
In-Depth Information
A
120
100
80
Knickpoints & Terraces
Elder Creek knickpoints
knickpoint
T3
60
40
20
0
T2
knickpoint
T1
channel bed
0
1000
2000
3000
4000
5000
Distance Upstream (m)
B
500
t r i b u t a r i e s
Waipoa
catchment
8
6
400
8
300
7
6
7
5
4
3
2
1
200
2
4
100
3
5
0
5
10
1
Distance Upstream (m)
992
C
Vertical Exaggeration: 30x
newly formed
strath surface
sediment
veneer
990
check
dam
1999
2000
(post-seismic
profile)
988
sediment
wedge
986
Post-Seismic
Knickpoint Retreat
984
98
600
700
800
900
1000
1100
1200
Distance Upstream (m)
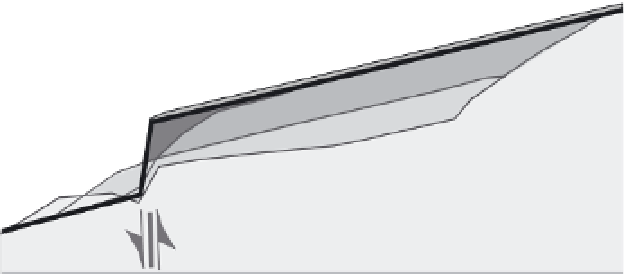
Fig. 8.7
Fluvial knickpoints in California, New Zealand, and Taiwan.
A. Longitudinal river profile of Elder Creek, California, showing two knickpoints that are carved in bedrock. T
1
and T
2
represent strath (bedrock) terraces that appear graded to the crest of individual knickpoints. The terrace-knickpoint
geometry suggests that the knickpoint migrated progressively upstream and caused abandonment of its previous bed,
which now forms the associated strath terrace. Modified after Seidl and Dietrich (1992). B. Fluvial knickpoints in the
Waipaoa catchment, New Zealand. River profiles extracted from a 25-m DEM show knickpoints 50-100 m high on
small tributary channels. A wave of incision is interpreted to have swept up the Waipaoa catchment beginning ~18 ka.
Whereas rapid knickpoint retreat occurred in the main channels, knickpoint migration stalled near the mouth of many
smaller tributaries, as shown in the map. Modified after Crosby and Whipple (2006). C. Knickpoint retreat after the
1999 Chi-Chi
M
s
=
7.6 earthquake. Following ~3-4 m of vertical, coseismic displacement, repeated channel surveys
document rapid knickpoint retreat across the shales in the hanging wall. In 2001, the average retreat rate was
~1 m/day, whereas from 2001 to 2003, the channel profile was lowered about 2 m (probably by waves of knickpoint
migration originating at the fault scarp), despite little migration of the upstream extent of the knickpoint. By 2001,
extensive sediment accumulated adjacent to the fault in its footwall. Modified after Sklar
et al.
, 2005).
of erosion with respect to the upstream segment
of the river has been lowered across the fault.
The abrupt changes in channel slope repre-
sented by a knickpoint are readily discernible
in river profiles extracted from relatively
high-resolution DEMs. When projected in
log slope-log area space (Fig. 8.8), the steepened
channel slopes of the knickpoint zone rise


