Geology Reference
In-Depth Information
temperatures create valuable opportunities for a
thermochronologist. Consider a single rock sam-
ple from which multiple, datable minerals can be
extracted. Based on
39
Ar/
40
Ar dating of horn-
blende, muscovite, and potassium feldspar, on (U-
Th)/He dating of apatite and zircon, and on OSL
dating of quartz, a cooling history spanning from
525
°
C to 35
°
C might be generated (Table 7.2).
Contrasts in the rate of cooling through time
can be interpreted from the radiometric data in
order to delineate variations in long-term erosion
rates (Fig. 7.19). When cooling rates accelerate
toward the present, they are often interpreted to
result from enhanced rates of denudation. If no
local geological evidence indicates recent nor-
mal faulting that could have accelerated cooling,
enhanced erosion by surface processes is typi-
cally invoked to explain the rapid cooling.
The perennial problem encountered when try-
ing to convert cooling rates to erosion rates is
that the local geothermal gradient is almost never
reliably defined. Most commonly, a “typical” con-
tinental geotherm of 20-30
°
C/km is assumed
and cooling rates are converted to erosion rates
on this basis. First, the depth (
z
) from which the
rock came to the surface is calculated:
Table 7.2
Radiometric dating systems and closure
temperatures for some minerals.
Mineral
Dating system
Closure temperature (
°
C)
Hornblende
40
Ar/
39
Ar
525
±
25
Muscovite
40
Ar/
39
Ar
350
±
25
Biotite
40
Ar/
39
Ar
300
±
25
K-feldspar
40
Ar/
39
Ar
200
±
25
Monazite
U-Pb
525
±
25
Biotite
Rb-Sr
275
±
25
Sphene
fission-track
275
±
50
Zircon
fission-track
250
±
30
Apatite
fission-track
120
±
20
Zircon
(U-Th)/He
180
±
20
Apatite
(U-Th)/He
70
±
15
Apatite
(U-Th)/He:
4
He/
3
He
40
±
10
Quartz
OSL
35
±
10
600
Cooling Histories
Ar/Ar hornblende
500
400
Ar/Ar
muscovite
300
Ar/Ar k-feldspar
200
zircon He
100
apatite He
z
=
c
/(d
T
/d
z
)
(7.6)
0
0
24681 2 4 6 8
Time before present (Ma)
0
20
where
c
is the closure temperature for the dated
mineral, and d
T
/d
z
is the geothermal gradient.
Then, the mean erosion rate (
e
) is estimated as
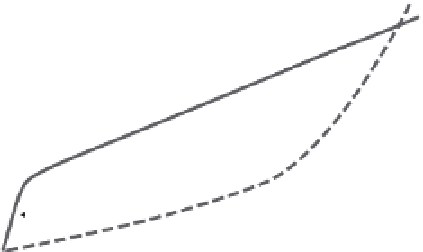
Fig. 7.19
Contrasting cooling histories from
thermochronology.
Hypothetic example of cooling histories using two
thermochronometers (
39
Ar/
40
Ar and (U-Th)/He dating)
on five different minerals taken from two rock samples.
One sample (solid line) displays rapid cooling at
∼
150
°
C/Myr since
∼
1 Ma, whereas the other (dashed
line) shows cooling at a mean rate of
∼
15
°
C/Myr for the
past 13 Myr. Even with significant uncertainties in the
geotherm, these data would suggest rapid Quaternary
denudation for the first sample (>2 mm/yr).
e
=
z
/
a
(7.7)
where
a
is the time of cooling through the
closure temperature. Thus, a rock that cooled
below 200
°
C about 2 Ma would be interpreted to
have been at 6-10 km depth at that time, assum-
ing a geothermal gradient of 20-30
°
C/km, and to
have been brought to the surface, via erosion, at
a rate of 3-5 km/Myr (3-5 mm/yr). Even if the
geothermal gradient were known at the start of
accelerated denudation, that gradient would not
persist during rapid erosion. The “rise” of rocks
toward the surface would advect heat upwards,
such that the local geotherm would be steepened.
Theoretical models of warping of isotherms
during rapid erosion and cooling (Craw
et al.
,
1994; Mancktelow and Grasemann, 1997; Stüwe
et al.
, 1994) suggest that gradients as high as
60-100
°
C/km might be achieved with erosion
rates greater than 5 mm/yr. Isotherms can be fur-
ther warped by fluid flow in the crust, which
tends to remove heat from peaks and add heat to
valleys (Whipp and Ehlers, 2007). The unknown
nature of the local geotherm during cooling
suggests that large uncertainties should be placed
on most erosion rates that are deduced from