Geology Reference
In-Depth Information
Erosion Rates with Cosmogenic Nuclides
1
2
δ
z
Curvature,C
=
regolith
δ
x
2
H
er
1
2
bedrock
er
2
z
x
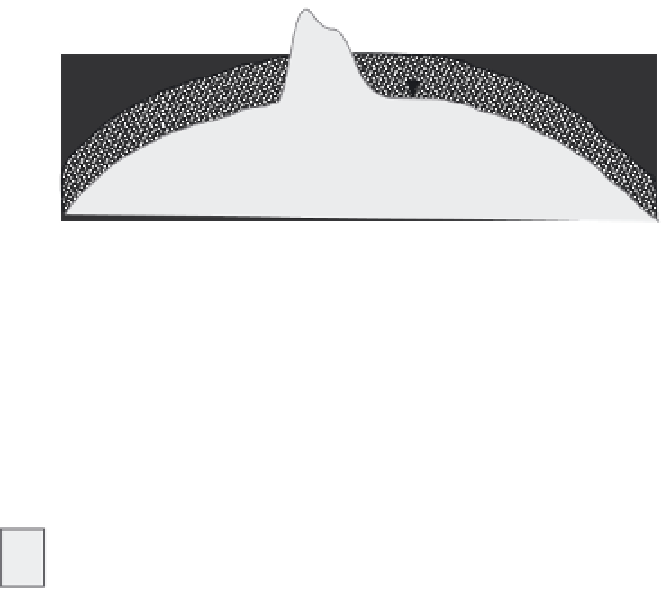
Sample Site 1: Bedrock erosion rate (er
1
)
depends on production rate at the sample
site, P
o
(function of latitude and altitude),
depth (z*) at which production rate equals
P
o
/e, and concentration of radionuclides
[CRN]:
er
1
= (ignoring decay)
Sample site 2: Bedrock conversion-to-soil
rate (er
2
) depends on the thickness of soil
(H) which is assumed to be in steady state.
Production rat
e
P
o
z*
(0.6 m rock,
0.8m regolith)
P
o
z*
[CRN]
P=P
o
e
(-z/z*)
(
P
o
e
(-H/z*)
)
z*
[CRN]
A
er
2
= (ignoring decay)
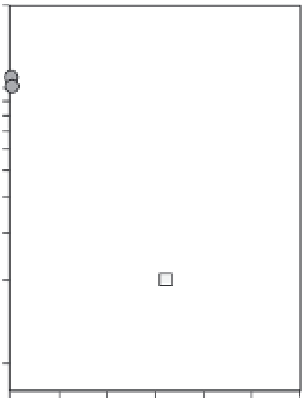
200
0.12
Soil Production
Rates
Soil Depth
& Hillslope
Curvature
100
0.08
Point Reyes, USA
80
60
Nunnock River, AUS
divergent
(nose)
40
0.04
30
20
tors
0.0
convergent
(hollow)
10
-0.04
0
40
80
120
0
40
80
120
B
C
Soil Depth (cm)
Soil Depth (cm)
Fig. 7.12
Erosion and regolith production rates based on cosmogenic nuclides.
A. On bedrock knobs (site 1), surface concentrations of cosmogenic radionuclides produced
in situ
yield bare-bedrock
long-term erosion rate estimates, whereas those at the bedrock-regolith interface (site 2) yield rock-regolith
conversion rates beneath a regolith cover with an assumed steady-state thickness,
H
. If the entire system is in steady
state, these rates should agree with each other. The curvature of the hillcrest (
C
) can be used in combination with the
regolith production rate,
er
2
, to yield an estimate of the landscape diffusivity,
k
(
=
er
2
/
C
), which relates regolith flux to
local slope. Inset depicts change in production with depth and defines
z
*, where production is 1/e times the surface
production rate. B. Soil production rates as a function of soil thickness, showing that rates are fastest when soils are
thinnest. C. Soil depth as a function of slope curvature, indicating that soils are thinnest where curvature is highest.
Modified after Heimsath
et al.
(2005).