Geology Reference
In-Depth Information
4000
peak elevation
800 m
3000
glacial
troughs
1900 m
2000
mean
elevation
1000
1100 m
Differential Dissection
& Isostatic Uplift
0
-1000
0
100
200
300
400
500
600
700
800
Distance (km)
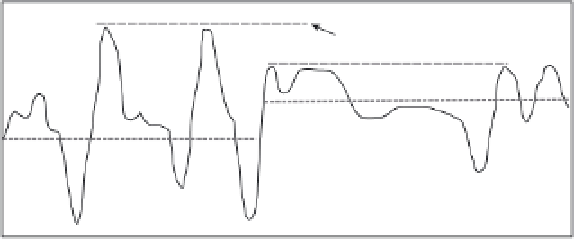
Fig. 7.10
Differential dissection and isostatic uplift of the Transantarctic Mountains.
The summits between 100 and 800 km approximate the position of a pre-rifting erosion surface. Deep glacial incision
has lowered the mean elevation about 800 m more between 0 and 350 km than between 350 and 800 km. In turn, the
peaks are about 800 m higher where incision is greater. Because 800 m of decrease in mean elevation would be
expected to produce only 650 m of peak uplift, the extra 150 m of uplift may be due to some tectonic contribution or
to flexure due to three-dimensional differences in erosion. Because the timing of erosion is only loosely constrained
as post-Cretaceous, rates of erosion or peak uplift cannot be well defined. Modified after Stern
et al.
(2005).
of which are nearly flat-topped, or by largely
undissected, but isolated surfaces (Fig. 7.10). If
the former continuity of such surfaces can be
demonstrated and the age of the surface can be
ascertained, an extensive datum can be defined.
Subtraction of the modern topography from this
datum can define the volume and mean rate of
erosion since the surface began to be incised.
Given a knowledge of the eroded mass of rock,
the isostatically driven response to its removal
can be calculated, and it is therefore possible to
determine to what extent the undissected peaks
and surfaces would be raised in response to an
overall lowering of the mean elevation due
to erosion. The uplifted rift flank of the
Transantarctic Mountains provides an illustra-
tive example of these concepts (Fig. 7.10).
Whereas the high peaks of these mountains are
in a perennially frozen zone that experiences
little erosion, glaciers in the intervening valleys
have created deep troughs and have generated
4 km of relief (Stern
et al.
, 2005). The summits
are higher where both incision has been greater
and the mean elevation is lower: observations
consistent with erosionally driven rock uplift.
rates. A conservative tracer is defined as a
measurable quantity that does not change its
value due to transport alone, but can change in
response to additions or subtractions to the load
or discharge of a river. Some examples of gener-
ally conservative tracers include isotopic ratios
for non-reactive elements, age distributions of
detrital grains, and zircon concentrations. These
examples are not necessarily truly conservative
tracers, because they can change downstream
due to chemical reactions or abrasion, even in
the absence of any new additions. Such changes,
however, are typically slow in comparison to
transport times and can, therefore, usually be
neglected. For example, the isotopic signature
that is contained in water samples or in
transported sediments changes as a function of
variations in both isotopic ratios and erosion
rates as successive tributaries join the trunk
stream (Fig. 7.11).
Conservative tracers that can be tied to
distinctive source areas can be used to define
relative rates of erosion. Consider, for example,
a mountain range in which the high peaks near
the drainage divide have tracer characteristics
(such as cooling ages or isotopic ratios) that are
distinct from those in the surrounding terrain.
Near the headwaters of the rivers and adjacent
to these high peaks, one would expect that the
tracer in water or sediment samples would
Erosion rates based on mixing models
Conservative tracers in fluvial systems can be
exploited to deduce spatial variations in erosion