Geology Reference
In-Depth Information
of lichen sizes corresponding to those events
might provide calibration points for a growth
curve that can be used to date other sites.
Recent studies in the South Island of New
Zealand have demonstrated the utility of
lichenometric dating of rockfall deposits (Bull
and Brandon, 1998; Bull
et al.
, 1994). For each
rockfall deposit studied and on each block that
meets a certain size criterion, the largest lichen
diameter was measured, such that hundreds of
measurements were assembled at a site. The data
collection was aided greatly by the use of an
automatically recording digital caliper. When
several thousand lichen measurements from a
large region are synthesized into a histogram
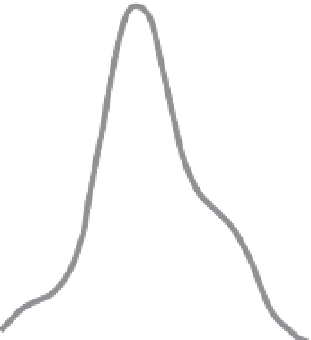
(Fig. 6.19), a very irregular and spiky distribution
of lichen diameters is apparent. If lichen growth
rates were highly variable from place to place
or if rockfall events were randomly distributed
through time and space, then the histogram
should not exhibit discrete peaks in lichen
diameter. In fact, given the density of these data,
it is clearly possible to differentiate peaks
separated by only 2-3 mm. When converted
to ages, these size increments represent age
differences of approximately 30-40 years. In the
New Zealand study, six of the peaks can be
assigned to specific historical earthquakes; it is
probable that five other earthquakes pre-dating
1866 are also represented (Bull and Brandon,
1998). When interpreting such data, one caveat
should be kept in mind: non-seismic triggers,
such as exceptional storms or avalanches, also
have the potential to produce bulk additions to
a rockfall deposit.
Beyond delineating past earthquakes, dated
rockfall deposits can be used to estimate the
amount of shaking that occurred at a site (Bull
et al.
, 1994). All other variables being equal,
the number of rockfall blocks resulting from
a given earthquake might be expected to be a
function of both the size and the proximity of
an earthquake. Larger earthquakes produce
more shaking than small earthquakes on the
same fault, and the greater the distance from
the epicenter, the lower the shaking at a site.
Based on the dates of historical earthquakes
and the lichen diameters associated with those
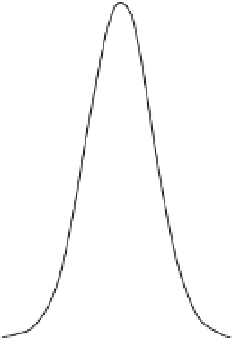
Rockfall Abundances Reflecting Size
and Distance of Past Earthquakes
0.1 mm
close M 6.9
ear
th
quake
95% confid
e
nce limits
for gaussian probability
de
ns
ity
16.3
±
0.08
23.2±0.1 mm
nearby M >6.5
earthquake
0.04
8.5±0.4 mm
distant M 7.1
earthquake
0
10
20
30
Largest lichen size (mm)
Fig. 6.26
Gaussian distributions of lichens
representing three earthquakes.
Histogram of lichen sizes at a local site after
decomposition into Gaussian curves, each associated
with a separate earthquake. The curves sum to yield the
approximate original distribution of sizes. The amount
of locally felt seismic shaking determines the height of
each Gaussian curve and is interpreted as a function of
the distance to the epicenter and the size of the
causative earthquake. Note that the largest earthquake
(
M
= 7.1) produced the smallest peak because of its
distant epicenter. Modified after Bull
et al.
(1994).
events, the lichen data for a given site can be
decomposed into a suite of Gaussian curves,
each of which is centered on the mean diameter
for the age of a specific earthquake and is
assigned a height and width, such that the suite
of curves will sum together to yield the overall
distribution of measured lichen sizes (Fig. 6.26).
The relative height of the individual Gaussian
curves is used to infer the amount of shaking at
the site during each earthquake. By analyzing
the local lichen records from many areas, a
seismic shaking index may be determined for
each site for each earthquake. Moreover, for
prehistoric or poorly known earthquakes, these
shaking indices can be contoured for individual
earthquakes (Fig. 6.27) in order to define the
subregion where the epicenter was located
(Bull and Brandon, 1998).