Geology Reference
In-Depth Information
700
Coseismic Offsets in the 1992 Landers Earthquake
Histogram of Offsets
0.25
3.8 m
mean
2.4 m
mean
600
0.2
Central
Emerson
Fault
500
Central
Emerson
Fault
0.15
400
300
0.1
200
0.05
100
0
0
0
1
2
3
4
5
6
7
0
200
400
600
800
A
B
Distance along strike (km)
Right-lateral slip (cm)
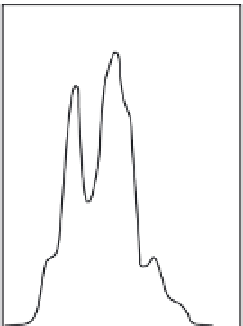
Fig. 6.21
Coseismic offsets in the 1992 Landers earthquake.
Measured displacements resulting from the 1992 Landers
M
w
=
7.3 earthquake along a 6 km segment of the central
Emerson Fault. A. These data were collected shortly after the rupture and include ephemeral linear features, such as
tire tracks, that were offset by the earthquake. The 85 km long Landers rupture involved several nearby faults. The
6 km long segment of the Emerson Fault shown here represents only 10% of the total length of the Emerson Fault
that ruptured in 1992. Surprisingly, this short segment appears to display a sinusoidal pattern of displacements that is
reminiscent of merged bow-shaped displacement gradients (Figs 4.9 and 4.14) that would result from slip on separate
rupture patches. B. Histogram of displacements (represented as Gaussian probability density functions) along the
central Emerson Fault. Note the bimodal nature of the histogram, which would typically be interpreted to have
resulted from two earthquakes, rather than one. Modified after McGill and Rubin (1999).
Whereas the data from trenches often allow
determination of when past ruptures occurred
and sometimes permit the magnitude of offset
to be determined, geomorphic studies of offset
features can clearly define displacements,
but often say little about timing, recurrence
intervals, or slip rates. At least two approaches
can address the issue of timing. The most obvious
approach is via direct dating of the offset fea-
tures (Fig. 6.22). For older dated surfaces, the
accumulated displacement can be used to
estimate a long-term slip rate. With several ages
on offset, but pristine and, therefore, young,
geomorphic features, such as on small channels,
rills, or debris-flow levees, the intervals between
past earthquakes can sometimes be defined and
constraints can be placed on average recurrence
intervals. Alternatively, if mean slip rates across a
fault are known, the magnitude of measured
displacements can be divided by the long-term
slip rate to obtain an estimate of the recurrence
interval. A mean slip rate could be derived either
from geodetic measurements at the decadal scale
or from longer-term rates based on displaced
and dated Quaternary features, such as strand
lines, terraces, or alluvial fans (Fig. 6.22).
Whereas the concept of dating offset features
is straightforward, such dating almost always
requires diligence, luck, and interpretation. Two
recent studies of the same offset fan surface that
is cut by strands of the southern San Andreas
Fault reached rather different conclusions on
the age of the fan surface and the amount of
fault offset. These studies provide an illustration
of two challenges that paleoseismologists must
address: deriving reliable ages for an offset fea-
ture; and determining the actual amount of fault
slip. A study by van der Woerd
et al.
(2006) used
cosmogenic exposure ages on cobble-sized
clasts, determined a surface age of 35.5
±
2.5 ka
(Fig. 6.22C), assessed the fault displacement as
565 m (Fig. 6.22B), and calculated a mean slip
rate of
∼
16 mm/yr. A second study by Behr
et al.
(2010) also used cosmogenic dating, but found
that, for boulders less than
∼
0.5 m high, exposure
ages varied from 30 to 45 ka as a function of
clast size (Fig. 6.22D). Because taller boulders
gave more coherent ages around 50 ka, Behr