Geology Reference
In-Depth Information
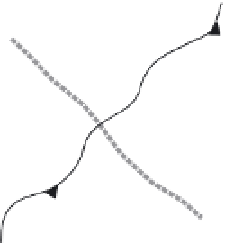
A
B
Map View
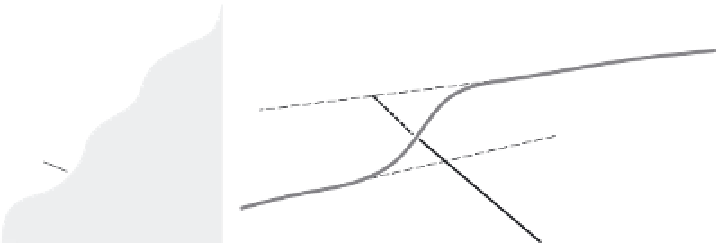
Sources of Uncertainty
X'
X
footwall
slope of
hangingwall
slope of
footwall
thrust
fault
uncertainty
X
position of
fault tip
dip of
fault
hangingwall
X'
C
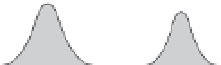
Monte Carlo Slip Calculation
3.4±1.5°
2.3±1°
2; -1,+4
52±9°
5.1±1.2 m
+
+
+
0°
7°
0°
5°
base
top
25°
75°
3 m
7 m
dip of
fault
slope of
hangingwall
slope of
footwall
position of
fault tip
slip on
fault
Fig. 6.17
Fault-slip calculations using Monte Carlo simulations.
A. Map of geodetic survey oriented perpendicular to the trace of a thrust fault. B. Projection of survey data on
to a vertical cross-section and associated types of uncertainty (gray zones). C. Some features, such as slopes of
geomorphic features, may have formal Gaussian uncertainties deriving from analysis of the surveyed data. For others,
such as the position of the fault tip, a probability distribution may have to be assigned based on observations of other
faults. Randomly chosen values from each distribution define a geometry from which a single slip calculation can be
made. Based on the outcome of thousands of simulations, the probability distribution of fault slip can be defined.
Modified after Davis
et al.
(2005).
therefore, one might expect to find numerous
markers that had been displaced in the most
recent earthquake, a lesser number displaced
during the penultimate rupture, and so forth.
Such landscapes could be described as
palimpsest
landscapes in which the imprint of
older features is only partially overprinted or
obscured by younger features. Quite commonly,
the size of an offset may not be large enough
relative to the scale of the geomorphic feature
to have altered it significantly, or to have
caused its abandonment. This ratio of scales
is, therefore, important in determining if a
particular landscape will record individual
coseismic offsets, or if instead it will record only
the long-term average slip on the fault, because
it smears out the effects of individual events.
Clearly, the record of offset features represents
an interaction between the processes that create
geomorphic markers and the tectonic events
that displace them. The variability of climate
suggests that some intervals will be more
conducive than others to the formation of clear
geomorphic markers (Fuller
et al.
, 2009; Harkins
and Kirby, 2008; Pan
et al.
, 2003). For example,
during times of fluvial incision, many steep-
sided geomorphic features, such as channel
walls, terrace risers, and gullies, are etched into
the land surface and gently dipping features like
terrace treads are left behind, whereas during
aggradational phases, broad alluviated surfaces
provide fewer distinctive features that could
serve as geomorphic markers. Moreover,
aggradation can bury offset features and thus
obscure the record of older earthquakes. As a
consequence of these climatically controlled
contrasts, earthquakes that occurred after inter-
vals of incision are likely to be more clearly
represented in the geomorphic record than are
those that occurred during times of aggradation.
Paleoseismologists exploit these contrasting
regimes of incision and deposition. The offset
geomorphic features of incisional areas allow
ready identification of faults, whereas places
where faults cut areas of active deposition
are ones where the fault trace may be obscure,