Geology Reference
In-Depth Information
Observed versus Modeled Deformation
Subduction Model
locked
Interseismic:
pre -1935
Slip = 4.0
cm/yr
Slip = 5.5
cm/yr
A
Slip = 2.5
cm/yr
Modeled Deformation
C
Top interface
Bottom interface
Coseismic
Event:
1935
Coseismic
Interseismic
Slip = 2.3 m
B
D
Fig. 6.12
Modeling observed deformation to deduce slip on the subduction interface.
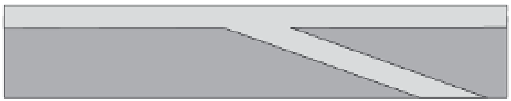
A. Elastic dislocation model of a subduction zone with slip on both the upper and lower interfaces bounding the
subducting slab. Modeled variables include the length and depth of any locked patch, as well as slip-rate variations
along each interface. Modified after Sieh
et al.
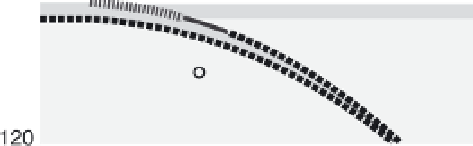
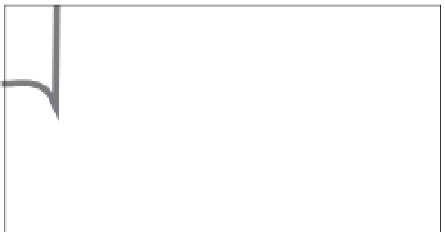
(1999). B. Predictions of deformation in the forearc. Elastic strain
occurs on both the upper and lower subduction interfaces. These strains are summed to produce the predicted
interseismic and coseismic deformation patterns at the surface. C. Best match to the observed forearc deformation
(black dots) prior to the 1935 earthquake in Sumatra predicts slow slip (2.5 cm/yr) on a patch that localizes the
predicted elastic deformation. D. Coral data are well matched by 2.3 m of coseismic slip on the patch that
experienced the slow interseismic slip. Modified after Natawidjaja
et al.
(2004).
that uplift rates increase to the northwest along
the coast (Fig. 2.6).
Note, however, that one must exercise caution
when deducing uplift from such storm berms,
because the initial height of a storm berm above
mean tidal position depends on the magnitude
of the storm waves. This height must be known
or deduced if we are to use such markers to
reconstruct the amount of local coseismic uplift.
An interesting lesson can be learned from the
Turakirae succession (Plate 1B) in this regard
(Grapes and Wellman, 1988, 1993). Until recently,
Fig. 6.11
(
cont'd
) (iv) Intervals of relative sea-level rise or stability create a micro-atoll. (v) Complex relative sea-level
history creates a unique coral stratigraphy. Modified after Natawidjaja
et al.
(2004). B. Sketch of annual banded coral
from the Sumatran forearc. Heavy dark gray lines indicate erosion surfaces due to relative sea-level fall. Growth years
of annual bands are indicated. A
320
Th date (1948
±
20) has been determined near the base of the head. C. Relative
sea-level history constructed from the coral stratigraphy above. Note intervals of generally steady sea-level rise
(submergence) followed by abrupt emergence during earthquakes (EQ) around 1940, 1960, and 1980. The 20th-century
trend is one of overall submergence through several seismic cycles. Modified after Natawidjaja
et al.
(2004).