Geology Reference
In-Depth Information
Remotely Sensed, Downstream Glacial Velocity
100
data
p
oints
Rongbuk Glacier
(2000-2007)
80
80
mean
velocity
60
60
40
40
debris covered
20
20
0
0
2
4
6
8
10
12
14
16
0
Distance down glacier (km)
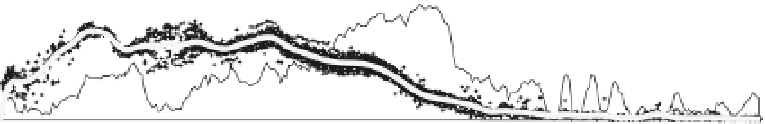
Fig. 5.20
Longitudinal glacier velocity from remote sensing analysis.
Velocity of the Rongbuk Glacier on the north flank of Everest as derived from analysis of ASTER and SPOT data.
The number of correlated data pairs varies along the glacier's length (gray shading). Commonly, many individual
measurements across the width of the glacier or over several time intervals provide a statistically robust measure of
the current velocity field (black crosses are individual measurements; central line is the mean). Note the concentration
of more rapid flow in the upper half of the glacier, whereas the debris-covered, lower half of the glacier is generally
stagnant. Modified after Scherler
et al
. (2011).
a geomorphic feature (e.g., Scherler
et al
., 2011).
This approach can provide a remarkably
detailed view of spatial variability in glacial
velocity (Fig. 5.20), earthflow motion, or
coseismic displacement. Such patterns of spatial
variability on glaciers, for example, provide a
clear framework in which to examine how
velocity and flow vary as a function of ice
discharge, glacier width, ice temperature, or
surface slope, as well as enabling an improved
assessment of how glacial erosion relates to ice
dynamics.
seismic deformation, radar interferometry is
providing an unprecedented, detailed view of
coseismic and interseismic deformation at a
regional scale. These data sets are generating new
perceptions of both the near- and far-field surface
effects of earthquakes, and they are guiding the
development of new models that more faithfully
mimic actual deformation. New techniques for
stacking radar images are permitting increasingly
subtle differences in deformation rates to be
illuminated. Over the past decade, GPS campaigns
have been conducted within many of the actively
deforming areas of the world, and we now have
a far better understanding of the regional
deformation field of the Earth. Numerous
permanent GPS networks have also been installed,
particularly in the vicinity of urban centers
confronted with a significant seismic hazard and
in many of the world's most seismically active
regions. Interferometric radar studies of lightly
vegetated, seismically active regions have become
more commonplace, whereas new automated
techniques for applying interferometry to urban,
vegetated, and mountainous areas are being
developed. Airborne and ground-based lidar
imaging is providing stunningly detailed topog-
raphy of geomorphic surfaces in many actively
deforming terrains.
A place still remains for traditional geodetic
studies. Many important geodetic problems in
tectonic geomorphology can be addressed
without recourse to expensive, high-precision
Summary
Technological advances in measurement
techniques during the past decade are ushering
in a new era of high-precision geodesy. This
geodesy is providing a much clearer view of
partitioning of deformation at annual to decadal
time scales. Now, small differences in the
velocity vectors between nearby crustal blocks
and even within individual blocks can be detected.
These measurements help to pinpoint those
zones where these differential movements must
be accommodated. Through GPS and VLBI
observations, the regional-scale driving forces
represented by lithospheric plates moving with
respect to each other are becoming better defined.
Whereas continuously recording GPS networks
now can provide almost real-time records of