Geology Reference
In-Depth Information
detailed evaluation of many landscape attributes,
such as terrace or hillslope geometries, or
channel width, roughness, and gradient within
diverse tectonic environments.
Following the 1999 Hector Mines
M
=
7.1
earthquake, a helicopter-based lidar survey was
conducted along the rupture (Hudnut
et al
.,
2002). These data provided a much more
laterally extensive perspective on displacements
than is commonly acquired by geologists on the
ground. Not only can the three-dimensional
topography and offset geomorphic features be
imaged in significant detail (Fig. 5.19A), but
topographic profiles that are parallel to the fault
rupture but lie on either side of it can be used
to calculate the average slip along any fault
segment. To the extent that considerable geo-
morphic continuity existed across the fault prior
to rupture, the amount of lateral and vertical
translation of one profile that is required to
match the other profile defines the magnitude of
surface slip (Fig. 5.19B).
A
LIDAR Shaded Relief
35
V=10 H
east
LIDAR Topo
As Surveyed
30
west
25
20
15
original
east
o
riginal
east
10
5
detail
After Slip
Adjustment
0
0
50
100
150
200
250
300
B
Distance along fault (m)
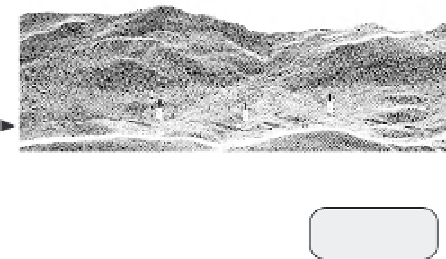
Fig. 5.19
Lidar topography of the Hector Mines
rupture.
A. Shaded relief of high-resolution lidar topography of
the terrain surrounding the surface trace of the 1999
Hector Mines rupture. The fault trace extends across the
base of the image. Arrowheads point to geomorphic
features that display dextral offsets across the fault.
B. Topographic profiles parallel to and on either side of
the Hector Mines rupture. Upper profiles show
topography projected perpendicular to the fault. The
eastern profile has to be translated down and to the
north in order to match the western profile. Inset
magnifies one portion of the profiles after fault slip is
removed and emphasizes both the displacement vector
and the excellent topographic match following
restoration. Note that the 10-fold vertical exaggeration
distorts the slip vector: actual slip is 3 : 1
horizontal : vertical.
ASTER imagery for rapid or
large-scale deformation
Although most geodetic studies are focused
on tectonic deformation, geodetic analysis of
rapidly moving geomorphological features,
such as glaciers or earthflows, can delineate
spatial variations in rates of movement. Such
data can be used, for example, both to examine
how flow rates vary as a function of slope,
width, or climatic parameters, or to calculate
volumetric fluxes or erosion rates as a function
of flow rates. For geomorphological features
that change at rates of meters per year, as well
as for seismic offsets of several meters, much
coarser-resolution satellite imagery can
sometimes be used as a geodetic tool to
delineate deformation rates or seismic offsets.
For example, imagery produced by NASA's
Advanced Spaceborne Thermal Emission and
Reflection Radiometer (ASTER) or by the French
Système Pour l'Observation de la Terre (SPOT)
has a spatial resolution (pixel size) ranging from
15 to 5 m, respectively. Careful orthorectification
based on topography derived from the Shuttle
Radar Topography Mission (Farr
et al
., 2007)
and co-registration of a succession of images
permits cross-correlation among image pairs
using a program such as COSI-Corr (Leprince
et al
., 2007) in order to define sub-pixel
displacements between the dates of the two
images. Because many correlated pairs of
individual pixels can be analyzed per image, a
statistical average velocity or displacement can
be obtained for a given longitudinal position on