Geology Reference
In-Depth Information
trilateration surveys can play an important role
in defining those faults with the potential for
destructive earthquakes.
Given a sufficiently dense array of surveyed
benchmarks, distinctive contrasts in the style
and magnitude of displacements at the regional
scale can be delineated. With strike-slip faults, it
is usually instructive to examine changes in the
velocity field along transects oriented perpen-
dicular to major faults and to the orientation of
the regional strain field. In this situation, the
data are most readily interpretable when the
velocity data from many sites are projected on to
a single plane perpendicular to the strain field.
EDM surveys along the San Andreas Fault in
California (Figs 5.5 and 5.6) clearly depict the
contrast between locked and creeping segments
of the San Andreas and adjacent faults (Lisowski
et al
., 1991). Throughout this zone, the relative
velocity of the North American Plate versus the
Pacific Plate is about 50 mm/yr (DeMets and
Dixon, 1999). A trilateration array east of
Monterey Bay depicts sharp offsets in the
velocity field across the San Andreas and
Calaveras Faults, whereas there is little differen-
tial movement for 20-30 km on either side of
these faults (Fig. 5.5A and B). Of the nearly
40 mm/yr of offset parallel to the San Andreas
Fault that is recorded in this region, more than
75% of the offset is accommodated by creep
along and immediately adjacent to the San
Andreas and Calaveras Faults. In contrast, in the
central Transverse Ranges of southern California
(Fig. 5.6), <25 mm/yr of the differential crustal
motion parallel to the San Andreas Fault is
recorded along a 90-km-wide swath centered on
the San Andreas Fault. Moreover, there is no
evidence for creep (in terms of rapid spatial
changes in the displacement gradient) as the
San Andreas Fault is crossed. Given the absence
of other major strike-slip faults in this transect
and the considerable strain that is occurring
across the fault, these data from the Transverse
Ranges suggest that the potential exists for a
major earthquake along this locked segment of
the fault in the future. A weak fault zone is
apparent in the Monterey array (Fig. 5.5), where
most of the motion between the North American
Plate and the Pacific Plate is accommodated in a
A
122°
121°
San Francisco
Bay
San Andreas
Fault
Trilateration
Array
Calaveras
Fault
36°
Monterey Bay
Network
0
50
km
B
20
10
SW
NE
0
Localized
Strain
-10
Monterey Bay
Network
-20
-40
-30
-20
-10
0
10
20
30
40
Distance perpendicular to San Andreas Fault (km)
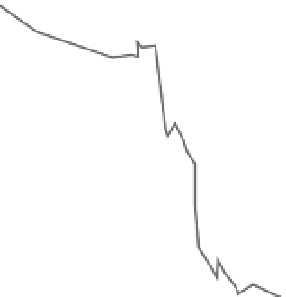
Fig. 5.5
San Andreas trilateration array in northern
California.
A. Monterey geodetic network showing triangulation
stations in the vicinity of the San Andreas and Calaveras
Faults. B. Results of trilateration surveys between 1973
and 1989 across the San Andreas Fault zone near
Monterey Bay. Data (projected on to a traverse oriented
perpendicular to the trend of the San Andreas Fault)
define the component of movement parallel to it.
Long-term slip rates across this San Andreas region are
about 35 mm/yr in this area, as indicated by the geodetic
data. About 15 mm/yr of North America-Pacific relative
plate motion accrues beyond the surveyed area. The San
Andreas and the Calaveras Faults are clearly marked by
abrupt changes in relative velocity. These discontinuities
show that most of the relative motion across this
80-km-wide zone is accommodated by slip (creep) on
these two faults. Little deformation occurs in the
bounding blocks. Modified after Lisowski
et al
. (1991).
narrow swath that is 10-15 km wide. In fact, in
that swath, 90% of the strain occurs on two
highly localized fault zones (San Andreas and
Calaveras Faults). In contrast, the broad regional
strain pattern in the Transverse Ranges (Fig. 5.6)