Geology Reference
In-Depth Information
0.02
0.02
A
B
L = 24 m, D
max
= 0.44m
L = 55 m, D
max
= 0.90m
L = 440 m,
D
max
= 4.90m
L = 500 m, D
max
= 9.40m
L = 60 m, D
max
= 1.00m
0.01
0.01
L = 540 m,
D
max
L = 167 m,D
max
= 3.30m
= 10.0m
L = 182 m,D
max
= 3.40m
20-200 m
400-600 m
0.00
0.00
0.02
1.0
D
C
L = 740 m,D
max
= 10.m
L = 780 m,D
max
= 10.m
L = 866 m,D
max
= 8.3 m
L = 1620 m,D
max
= 18 m
L = 1630 m,D
max
= 17 m
L = 2210 m,D
max
= 31 m
All faults
Length: 24 to 2210 m
Throw: 0.4 to 31 m
0.01
700-2500 m
0.0
0.00
0.5
0.5
0.0
1.0
0.0
1.0
Normalized distance
along the fault
Normalized distance
along the fault
normal faults
E
relay ramp
Bishop Tuff
Displacement-Length Scaling
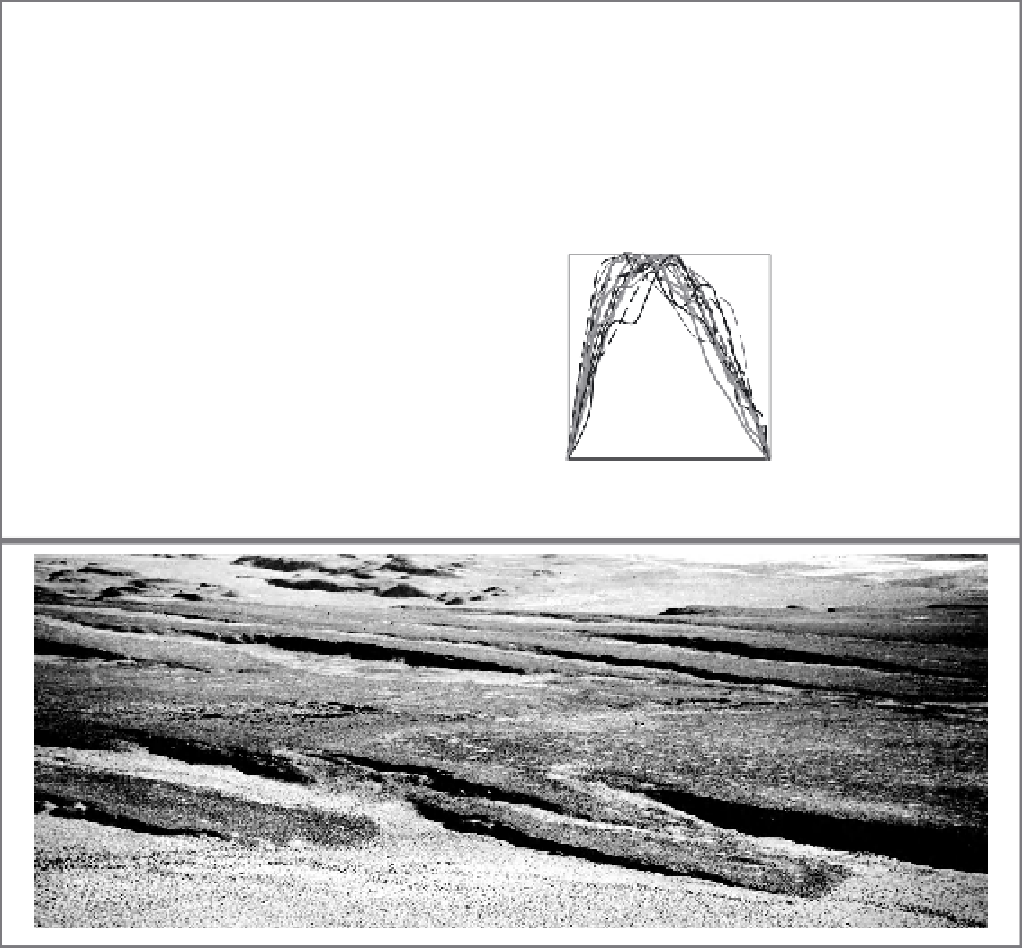
Fig. 4.9
Displacement-length scaling relationships.
Profiles of normalized fault length versus throw (normalized by fault length) for normal faults cutting the Bishop
Tuff, California. A. Faults 20-200 m long display roughly triangular profiles. Accumulated throw is
∼
2% of length.
B. Faults 400-600 m long. C. Faults 700-2500 m long display more bow-shaped profiles. Throw is
∼
1% of length.
D. All faults normalized by maximum throw. E. Aerial view of faults cutting the Bishop Tuff in the Volcanic
Tablelands of eastern California. Modified from Dawers
et al.
(1993).
few hundred meters, the maximum displace-
ment is a power-law function (
n
=
1.4-2) of fault
length: the ratio of displacement to length for
longer faults is as much as 100 times greater
than for shorter faults. This increasing ratio of
slip to length for longer faults also implies that
long faults propagate less readily than shorter
faults; this conclusion is consistent with an early
phase of fault lengthening and a later phase of
slip accumulation with little lengthening
(Walsh
et al.
, 2002). If the tip propagation of
longer faults is restrained, the possibility
increases of characteristic earthquake ruptures
along them. Such behavior would have a useful
predictive value. On the other hand, the appar-
ent evolution of cumulative slip distributions