Geology Reference
In-Depth Information
Box 4.1
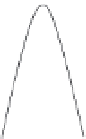
Magnitude-frequency relationships for earthquakes.
When extensive records of past earthquakes
along a given fault zone exist, statistical anal-
yses can reveal how earthquake magnitudes
relate to their frequency. Along many fault
systems, small- and intermediate-sized earth-
quakes show an inverse power-law fit known
as the Gutenberg-Richter (G-R) magnitude-
frequency relationship (see figure A).
relationships, the causes for this apparent
bimodality are important to understand.
A combination of earthquake theory with
some recent numerical models that simulate
hundreds of ruptures of different sizes (Zielke
and Arrowsmith, 2008) provides possible
insight on why this bimodal distribution
exists. First, recall some earthquake funda-
mentals. Fault slip begins when the shear
stress (
t
) along some portion of a fault
exceeds the product of the coefficient of
static friction
(
m
s
) and the effective normal
stress (
s
eff
) across the fault. Once slip initiates,
it will persist as long as the shear stress along
the fault adjacent to the failing region remains
greater than the product of the coefficient of
dynamic friction
(
m
d
) and the normal stress:
eff
dn
10
1
Gutenberg-
Richter
versus
Characteristic
Earthquakes
10
0
Char.
EQ
10
-1
tms
>
10
-2
The amount of shear stress released
coseismically (commonly termed the
stress
drop
,
Δ
10
-3
t
) is proportional to the difference
between the coefficients of friction:
m
s
−
m
d
.
The larger the difference, the greater the
stress drop and energy release, and the easier
it is for more of the fault surface to fail
progressively. In their model, Zielke and
Arrowsmith (2008) propose that the value of
m
s
−
m
d
, and therefore the coseismic stress
drop, changes with depth, mostly as a function
of temperature. The maximum stress drop is
predicted to occur at
∼
200
°
C, where labora-
tory friction experiments revealed maximum
velocity-weakening behavior for granitic
rocks (e.g., Blanpied
et al.
, 1991), equivalent
to a depth
z
p
of 8-12 km (see figure B).
Three key results emerge from Zielke and
Arrowsmith's (2008) numerical models. First,
within any given rupture area, the greatest
slip occurs where
Δ
3
4
5
6789
Magnitude
A
A. Earthquake magnitude-frequency distribution
along the San Andreas Fault. Modified after
Wesnousky (1994).
This relatio'nship provides a powerful
predictive tool for assessing the frequency of
an earthquake of any given magnitude.
Along fault systems with extensive paleoseis-
mic records, however, the frequency of
large, apparently characteristic, earthquakes
appears to violate the predictions derived from
smaller earthquakes: large earthquakes occur
more frequently than expected (Wesnousky,
1994). This apparently high frequency has
sparked considerable debate about why the
G-R scaling law seems to break down. Is the
earthquake record too short or incomplete?
Does the slope of the regression need to be
modified? Do multiple, different modes of
rupture exist? Because seismic hazard assess-
ments are partly based on these statistical
t
is greatest (see figure C).
Second, small to moderate earthquakes are
commonly confined to zones above or
below the depth,
z
p
, where
Δ
t
is a maximum.
Coseismic growth of a rupture front toward
z
p
is impeded because higher rupture-induced