Environmental Engineering Reference
In-Depth Information
Table 7.4
Scenario 3 'sustainable mobility'—
continued
SCENARIO RESULTS (relative to BAU 2041)
*
Absolute
Percentage
Climate: Carbon dioxide emission reduction
-6.72 MtCO2
-72.7%
(tonnes CO2)
0.6 tonnes CO2 per capita (2041) relative to BAU
of 3.8 tCO2 per capita (assumed aggregate BAU in
2041 is 8.03 MtCO2)
Accessibility: Improvement in accessibility
N/A
N/A
to town centres by public transit (
**
)
Economy: Annual car time
-19,477 million
-43.9%
(aggregate minutes)
***
Local environment: Affected population
-14,466 people
-20.5%
noise nuisance
Health: Vehicle road casualties by vehicle
-4.6 people
-43.8%
pollution (number of fatalities)
Notes
:
*
Modelling results, 2012.
**
Accessibility modelling not developed for this model version.
***
Annual car time
reduction is very high here. This reflects the modelling approach for the cycling package. There is no cycle (and walk)
model available in Auckland, hence future cycle movements were based on mode shift from a proportion of vehicle movements
under 10 km in length.
The modelling is based on individual model runs for each level of application of a policy package. MCA
indicator impacts are derived from travel distance, mode share and speed outputs.
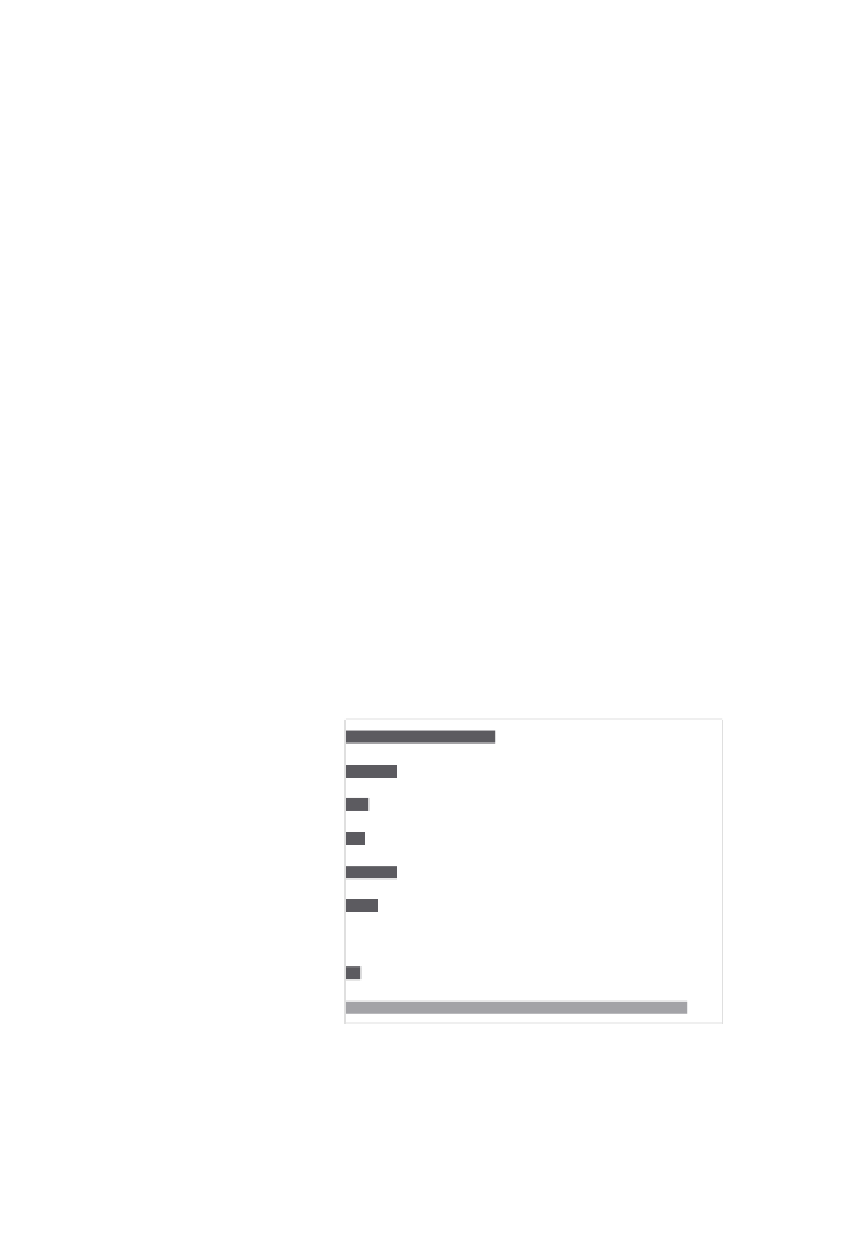
Contribution to Target CO
2
Reduction
0% 10% 20% 30% 40% 50% 60% 70% 80%
PP1 Low-emission vehicles
PP2 Alternative fuels
PP3 Ecological driving, slower speeds
PP4 Traffic demand management
PP5 Public transport, urban planning
PP6 Walking and cycling
PP8 Road construction
PP9 Freight transport
Total
Figure 7.24
Components of Scenario 3 sustainable mobility