Environmental Engineering Reference
In-Depth Information
Table 6.7
Scenario 1 CO2 outputs
Scenario
Car
Bus
Motorcycle
Taxi
NMT
All
1990 (tonnes)
89,913
206,037
180,246
155,621
-
631,818
1990 per capita
0.02
0.04
0.03
0.03
-
0.12
(tonne/person)
2005 (tonnes)
524,900
345,100
306,400
246,900
-
1,423,300
2005 per capita
0.08
0.05
0.05
0.04
-
0.22
(tonne/person)
2010 (tonnes)
2,441,233
484,400
246,914
285,284
-
3,457,830
2010 per capita
0.36
0.07
0.04
0.04
-
0.51
(tonne/person)
BAU 2030
15,212,371
259,621
416,388
384,615
-
16,272,995
(tonnes)
BAU 2030
1.85
0.03
0.05
0.05
-
1.98
per capita
(tonne/person)
BAU 1990-2030
230,906,958
13,593,463
11,757,124
11,214,220
-
267,471,764
aggregate (tonnes)
Proportion of
10%
26,604,791
2030 budget
used by 2010
400,000,000
18,000,000
16,000,000
350,000,000
14,000,000
300,000,000
12,000,000
250,000,000
10,000,000
200,000,000
8,000,000
150,000,000
6,000,000
100,000,000
4,000,000
50,000,000
2,000,000
-
-
1990
2000
2005
2010
2020
2030
Year
Series7
NMT
Taxi
Motorcycle
Bus
CO
2
emissions
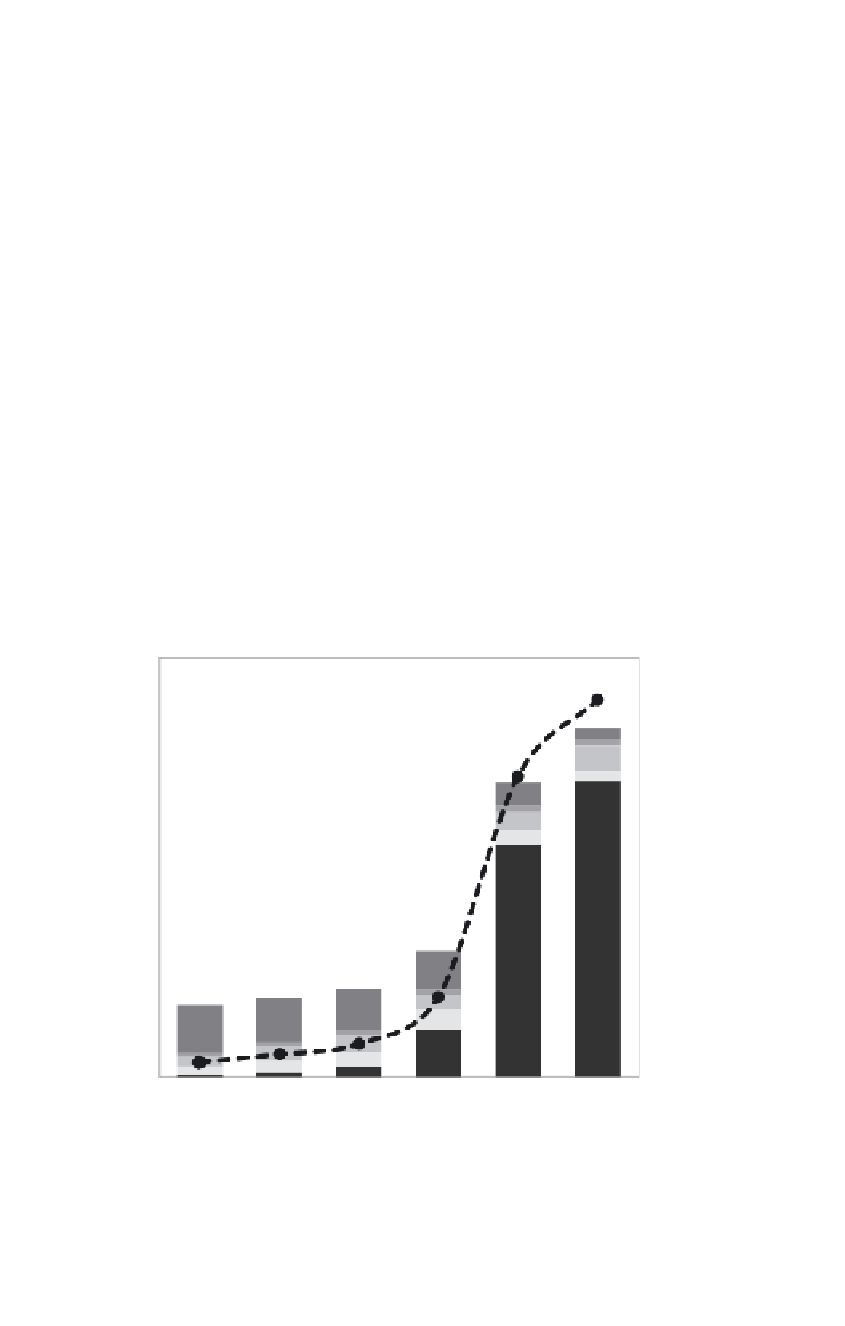
Figure 6.15
Transport distance by mode and CO2 emissions in Jinan (Scenario 1)