Biomedical Engineering Reference
In-Depth Information
Table 9.13: Typical Correlation Coefficients for
p
=
0.05
R
2
Equal or Greater Than
No. of Points
5
0.88
10
0.63
15
0.51
20
0.44
25
0.4
30
0.36
50
0.28
100
0.2
1000
0.06
160
140
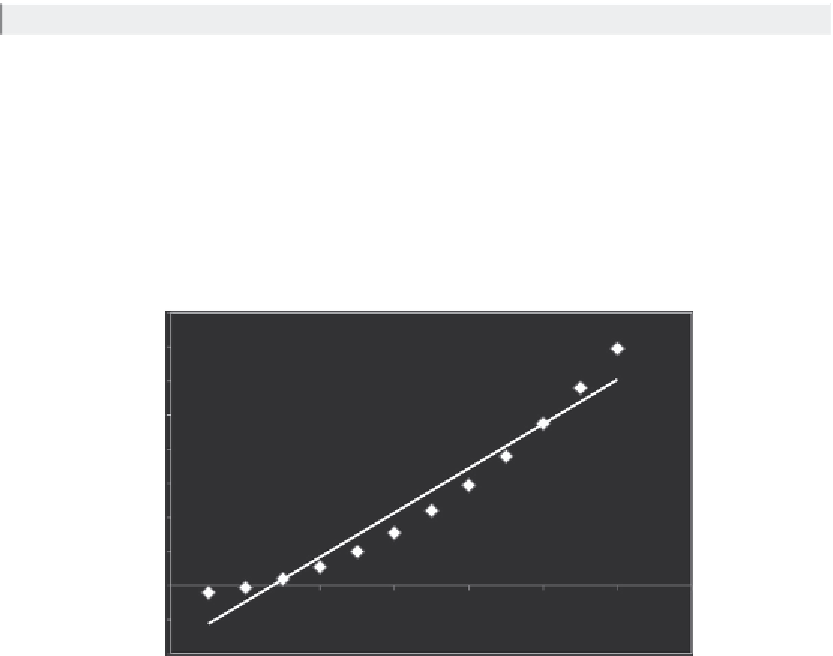
y = 13x - 35.333
R
2
= 0.9477
120
100
80
60
40
20
0
0
2
4
6
8
10
12
14
-20
-40
Figure 9.23
Illustration of a good correlation result but clearly a nonlinear graph.
Figure 9.22
yields an
R
2
of 0.08; much less than the 0.4 required. Hence there is no
correlation between duration and pain score. Take care: always check the graph as statistics
can lie because you may be trying to fit a straight line to a nonlinear data set (as illustrated in
Figure 9.23
).
9.6.6.3 Averages and Confidence Limits
An average value is arguably the most commonly quoted statistic in the world. It is, however,
the most misused. Quoting a single value is useless, as
Figure 9.24
illustrates. All three data
sets have the same average, but the spread of the data is wildly different.
This spread (or scatter) comes from naturally occurring variations (scientists and engineers
spend their whole lives trying to reduce this scatter). Some people, erroneously, describe the


Search WWH ::

Custom Search