Biomedical Engineering Reference
In-Depth Information
RISK ANALYSIS
1
2
3
Characteristic
Life Cycle Phase
Design, Manufacture, and Supply
Comment
Failure/Hazard
Effect
Hazard Relevance
= relevant
Root Cause(s)
4
5
6
7
8
9
10
11
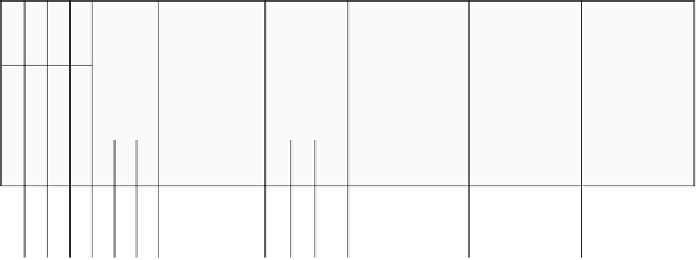
Figure 9.1
Example risk analysis pro forma.
failure modes for a particular hazard; a single failure mode is entered into box 2. Each failure
mode/hazard will have a particular effect (note this is related to the patient, the end-user, or the
surrounding environment - box 5); this is explained in box 3. Now you have to identify the root
cause, or the root causes (box 4); it is very likely that each hazard/failure will have a number of
potential root causes. This is where our Ishikawa diagrams and our reliability calculations come
into force (Chapter 7).
Table 9.3
is a summary of the potential root causes as stated in ISO 14971. It is by no means
comprehensive but it gives you some ideas. As stated earlier, and continuously throughout
this text, a comprehensive PDS and design procedure will have anticipated all of these root
causes and designed them out!
For each cause we now assess the risk (box 6). Similar to what we examined in FMEA,
we determine a level of severity (S) and a likelihood of occurrence (L). But unlike FMEA
we DO NOT include delectability. Our assessment of RISK level (RPN) is
RPNSL
(9.1)
As with FMEA, we need guidelines on setting values of L and S. ISO 14971 suggests values but
also lets the company allocate their own appropriate levels; those in
Table 9.4
are commonplace.
Note that severity is based on potential for injury; company embarrassment is no longer a
consideration!
We now have to assess if the risk is acceptable or not.
Table 9.5
illustrates a typical risk evaluation
table. ISO 14971 allows you to devise your own threshold values, but it is very common to have
three zones: a low risk zone (no controls required); a medium risk zone (controls should be
examined); and a high risk zone (controls need to be implemented to reduce risk).


Search WWH ::

Custom Search