Geoscience Reference
In-Depth Information
BOX 3.1
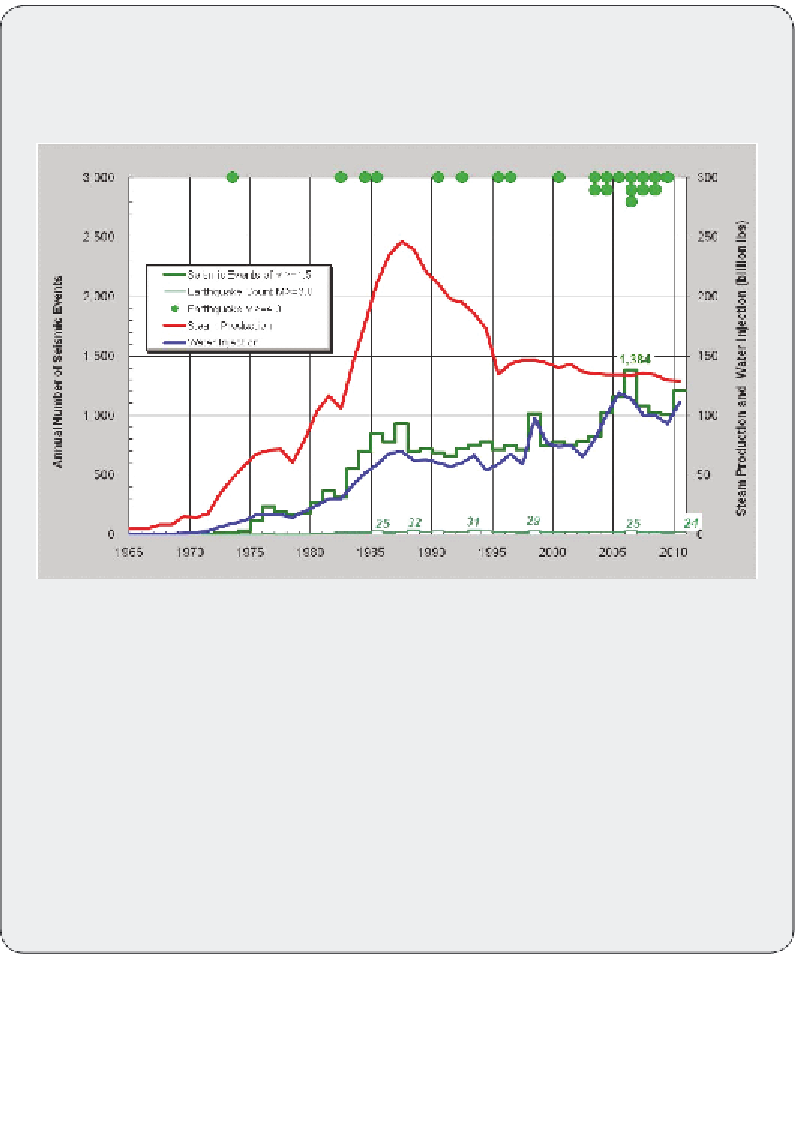
Geysers Annual Steam Production, Water Injection, and Observed Seismicity,
1965-2010
Figure
The history of induced seismicity at The Geysers is shown in three forms. First, the number of
recorded events of
M
1.5* and greater is shown to have increased from almost none in the 1960s to 112 in
1975 and then to as many as 1,384 in 2006 (thick green line). Second, the annual number of earthquakes
of
M
3.0 and greater is shown along the bottom of the graph (pale green line). By 1985, 25 such events
occurred annually, and that rate of about two events of
M
3.0 and greater per month has continued to the
present. Third, events of
M
4.0 and greater are shown near the top (green dots). The first such event occurred
in 1972, and more recently about one to three of these have occurred per year. The maximum magnitude
was a
M
4.67 event in May 2006.
SOURCES
:
Adapted from Smith et al. (2000) and Majer et al. (2007).
*Note that this report uses
M
2.0 as the general limit below which earthquakes cannot be felt by humans;
however, at The Geysers
M
1.5 is the lowest magnitude that the USGS can report faithfully year after year.
Furthermore, residents in Anderson Springs may feel events as low as
M
1.5 because the events are spatially
quite close to the community.
Search WWH ::

Custom Search