Geoscience Reference
In-Depth Information
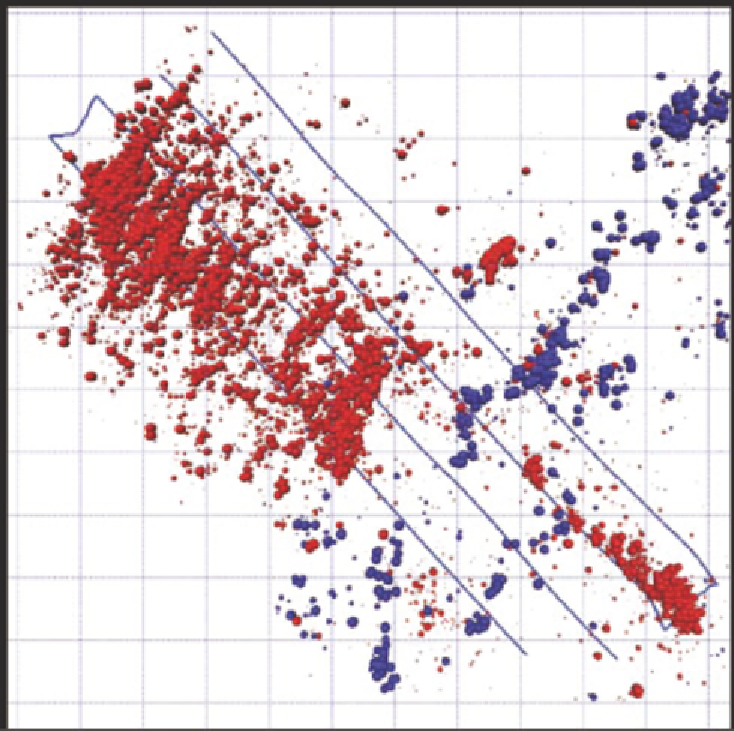
FIGURE I.3
Map view of hydraulic fracture microseismic events during a four-well stimulation (dark blue
lines on the map) in the Barnett Shale. Red events are interpreted to be associated with hydraulic fractur-
ing; blue dots indicate microseismicity associated with the reactivation of a strike-slip fault. See Wessels et
al. (2011) for details. Some hydraulic fracture stages were not mapped. SOURCE: Wessels et al. (2011).

Search WWH ::

Custom Search