Geoscience Reference
In-Depth Information
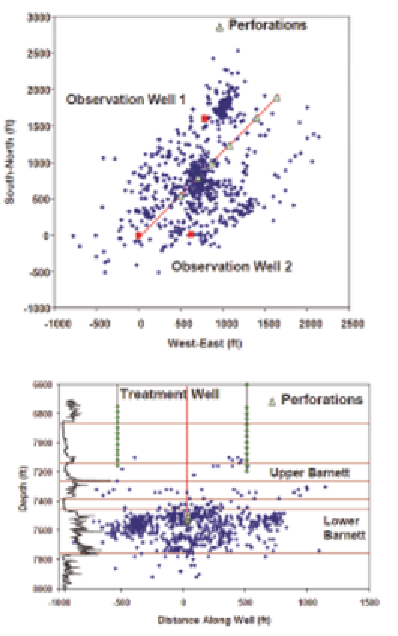
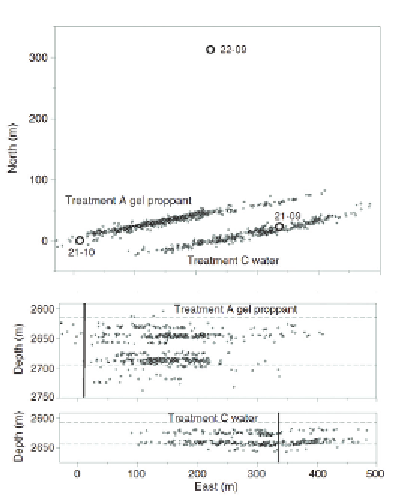
FIGURE I.2
Examples of microseismic borehole monitoring results following hydraulic fracturing proce-
dure. (a) On the left is a map (top) and cross section (bottom) view in the Barnett Shale after a multistage
hydraulic fracture treatment in a horizontal well (red line, triangles indicate perforation in wellbore where
fluid is injected); the small blue dots show the location of microseismic events mapped from two borehole
observation wells shown by red squares; seismic instruments are indicated by green circles. (b) On the
right is a map (top) and two cross-section (bottom) views of two vertical hydraulic fractured wells (white
circles) drilled in the tight gas sands of the Cotton Valley Formation. The small gray dots show microseismic
locations during a gel-based and water-based hydraulic fracturing fluid injection. SOURCE: Left, Warpinski
et al. (2005); right, Maxwell et al. (2010).

Search WWH ::

Custom Search