Geoscience Reference
In-Depth Information
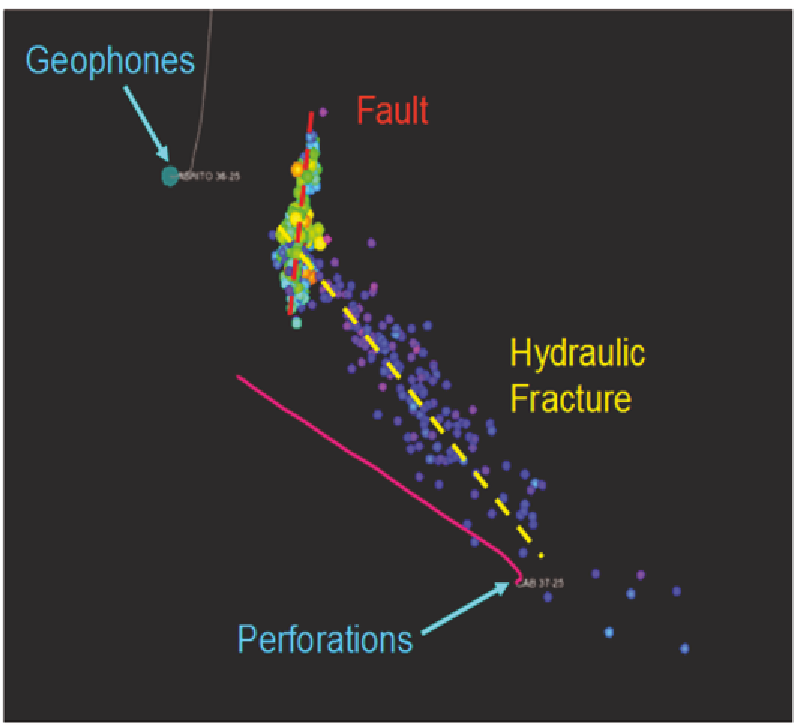
FIGURE E.3
Example of a reactivated fault during hydraulic fracturing. The figure is a map view of a
microseismicity (colored spheres which are colored by magnitude; cool colors are small events) during
a hydraulic fracture treatment. The fracturing well is shown by the pink line and is deviated away from
a central wellhead location and extends vertically through the reservoir section; the injection location is
labeled “Perforations.” The data were recorded and analyzed using borehole receivers (marked Geo-
phones). The blue dots show the growth of the hydraulic fracture to the northwest, then intersecting and
reactivating a small fault in the reservoir, shown by change in fracture orientation and larger magnitude
events (yellow dots). SOURCE: From Maxwell et al. (2008).

Search WWH ::

Custom Search