Geoscience Reference
In-Depth Information
Shale gas well 6
frac stage
average/day
Class II
disposal well
Geysers steam
field/ave inj well
Shale gas frac 15 well
20% frac water
recovery
Class II
disposal well
Geysers net loss
5.88E+7 m
3
water
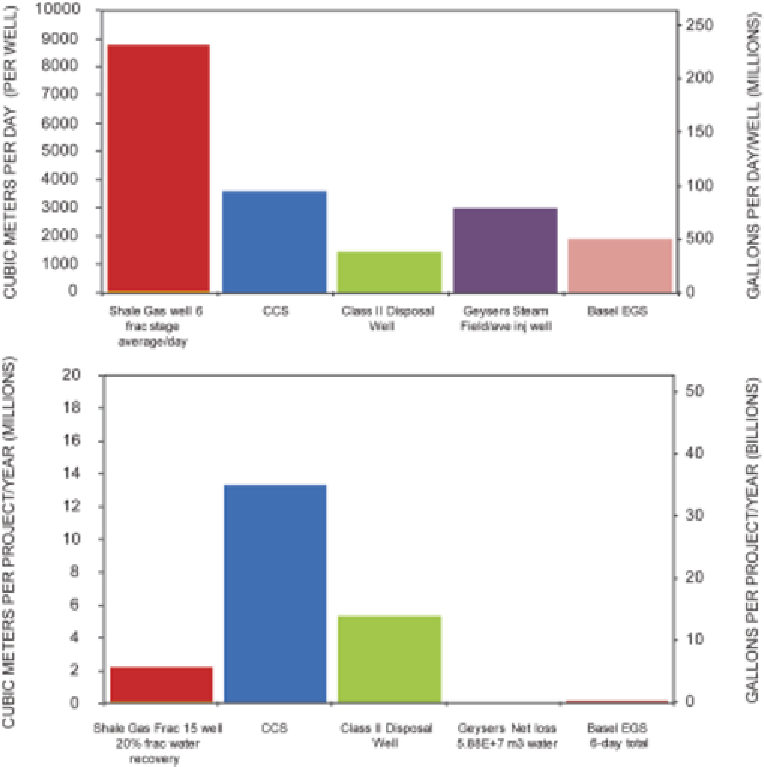
FIGURE 3.17
A comparison showing estimated injected fluid volumes for (1) shale gas hydraulic fractur-
ing, (2) CCS, (3) Class II waste and wastewater disposal wells, (4) The Geysers geothermal steam field for
an average injection well, and (5) the Basel EGS project per day (upper graph). The lower graph shows
the same information over a 1-year period for each project, with the exception of the Basel EGS project
(which operated in total for just 6 days before termination). Data are presented in Appendix L. The com-
mittee could not find reliable data per well or per field for hydrocarbon extraction (withdrawal) or for
secondary recovery (waterflooding). Hydraulic fracture volumes for shale gas assume a six-stage-per-day
program, with a 4.64 million gallon average per well (the “average freshwater volume for fracturing”
listed for five shale projects in King, 2012), estimating six hydraulic fracture treatments per day. For the
hydraulic yearly volume calculation, an estimate of 15 wells drilled over a project area in the course of
a year is made with a 20 percent recovery rate of injected fluid used. The CCS volume shown assumes
1 million tons (~0.9 million metric tonnes) of CO
2
injection per year, similar to the Sleipner field offshore
Norway. Class II disposal well data assume 9,000 barrels per day of wastewater injected. The Basel injec-
tion volumes averaged 0.5 million gallons per day for 6 days.


Search WWH ::

Custom Search