Geoscience Reference
In-Depth Information
Wastewater disposal
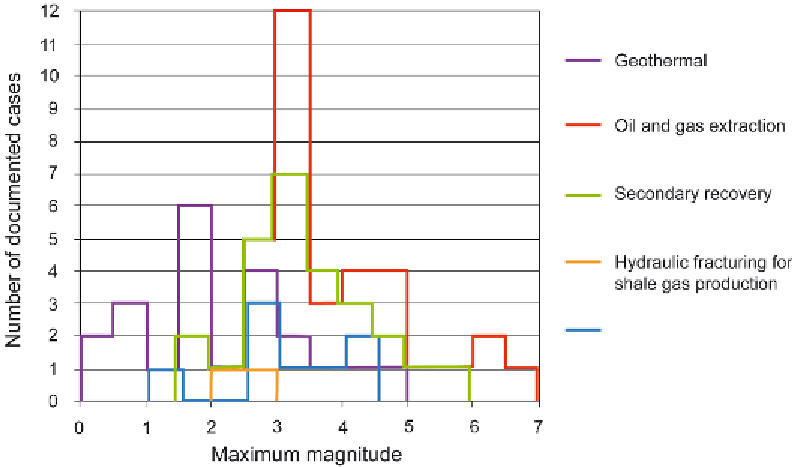
FIGURE 3.15
Histograms of maximum magnitudes documented in technical literature caused by or
likely related to subsurface energy production globally. Note: Many gas and oil fields undergo extraction
of hydrocarbons along with injection of water for secondary recovery, but if the reported total volume
of extracted fluids exceeds that of injection, the site is categorized as extraction. Some cases of induced
seismicity in the list above do not have reported magnitudes associated with earthquakes, and those cases
are not included in the counts used to develop this figure. No induced seismic events have been recognized
related to existing CCS projects. SOURCE: See Appendix C.
sion (COGCC) (CGS, 2012) in the injection well permitting process. The injection and
seismicity in the Raton Basin are under close scrutiny by both the CGS and COGCC. A
definitive link to injection has not been established in the Raton Basin seismicity. Enhanced
seismic arrays have been installed since 2011 in the area and will continue to be studied in
detail by field operators, the Colorado agencies, and the USGS.
Numerous geothermal sites report induced seismicity, but the associated maximum
magnitudes are generally small, with a maximum reported
M
4.6 (at The Geysers site in
California). Finally, felt seismic events caused by hydraulic fracturing are small and rare,
with only one incident globally of hydraulic fracturing causing induced seismicity less than
M
3 (in Blackpool, England; note the description in Appendix J of the seismic event in
Eola, Oklahoma).
Several authors have observed that the maximum magnitudes of seismic events induced
by various causes are related to the dimension or volume of human activity. Figure 3.16
(modified from Figure 3 of Nicol et al., 2011) plots the largest earthquake magnitudes

Search WWH ::

Custom Search