Environmental Engineering Reference
In-Depth Information
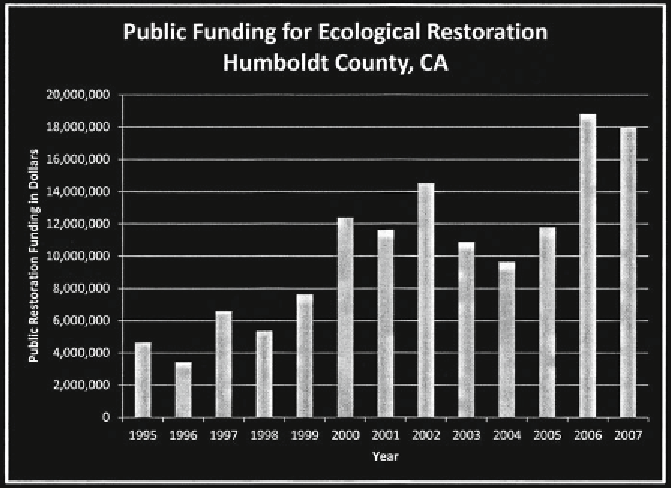
FIGURE 16.2.
Public funding for ecological restoration, Humboldt County, California,
1995-2007.
(Section 319[h]), are administered by the SWRCB and its regional counterparts.
Changes in patterns of restoration funding within these two agencies provide insights
into changes within the overall restoration system in Humboldt County.
As table 16.1 indicates, annual DFG funding for restoration has decreased since its
peak years of 2000 to 2005, while SWRCB funding has exploded since 2002. Despite
the overall decline in DFG funding levels for restoration, the average amount funded
per project has dramatically increased during the last fourteen years, as figure 16.3
shows. For example, DFG funding for restoration in 2006 was less than one-third of
what it was in 2005, yet the average amount funded per project dropped only slightly
from $140,000 to slightly more than $120,000. This amount is still significantly higher
than the average per project funding level of between $20,000 and $60,000, which pre-
vailed throughout the 1990s. These shifts imply a significant change in the overall pat-
tern of DFG restoration funding toward fewer, larger, more technically and ecologi-
cally complex restoration projects. Practitioners we interviewed also expressed concern
about what they perceive to be a decreasing emphasis within the DFG on watershed
education. Our data support this perception. The agency funded three education and
outreach projects in 2003, three in 2004, two in 2005, and one in both 2006 and 2007.
4
Overall, current patterns of DFG funding favor larger restoration firms and contractors
with the requisite skills and capacity to manage large-scale projects.
The SWRCB has adopted a similar pattern of funding fewer, large-scale restora-
tion projects. In part, this is a response to the dramatically increased amounts of resto-
ration funding that Propositions 40 and 50 generated, which the SWRCB was