Geology Reference
In-Depth Information
Marsh, l 978a, l 979a, 1981b; Silkiluwasha, 1981;
Mturi, 1983, 1991). Man has also influenced the
distribuion of the Zanzibar red colobus through
translocaion as reported above (see Figure 12.1).
/
I
Mehods
he study site
,
I
I
I
The study of the Zanzibar red colobus was con-
ducted mainly at Jozani Forest Reserve, and
Kichanga, a small area just 100 m south of Jozani
Forest Reseve; in addiion, there were three
opportunisic study sites: Pete, Muungwi and
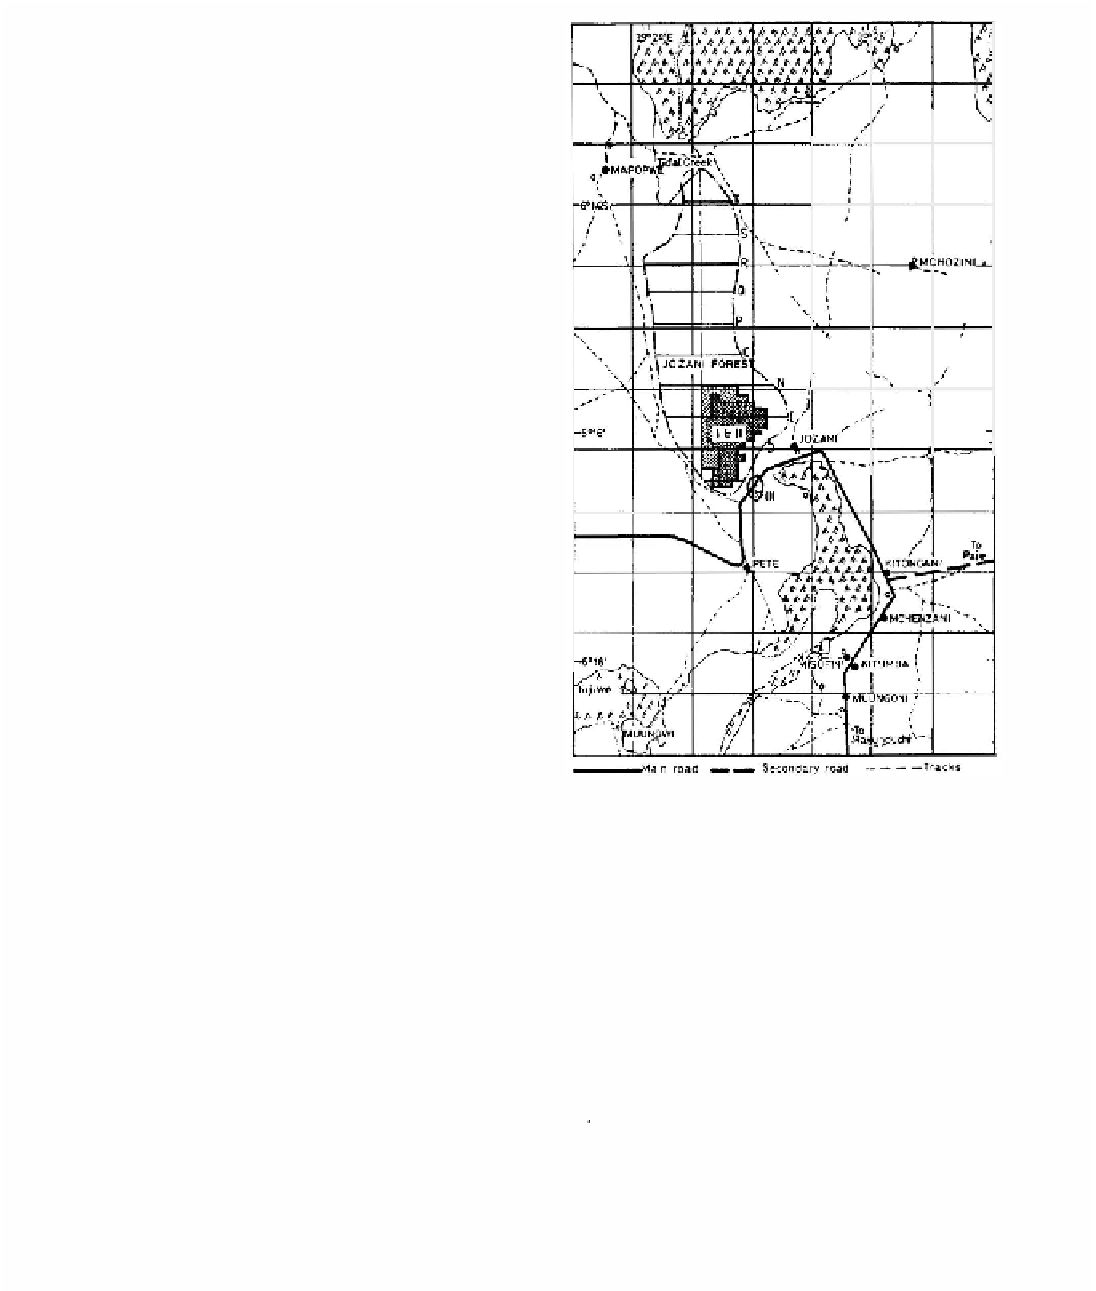
Muungoni (Figure 12.2).
--.+
' ----'--, --- ',
-,--��C,O ZINI
I
\
,'
... .. _>
' .
\
.
I
I
I
,
j
..
I '
I
',,
'
/
'
'
/
'>
-'
,. . '\
\I
\I
d
,, BUNGI
,
Preparation of the study site
The entire Jozani Forest Reserve was divided into
nine east-west grid paths at 500 m intervals and
one north-south path. The southen part of the
Reserve was divided into 100 m2 quadrats. This
was the intensive study site (Figure 12.2).
From
anzib•r
own
Animal study
The field research on the Zanzibar red colobus
covered the period January 1980-April 1981.
Three groups (I, II and III) were habituated prior
to the systemaic study. To obtain data on
behaviour, groups I and II, which ranged in the
southen part of Jozani Forest Reseve (Figure
12.2), were each subject to a period of 5 days per
month of systemaic obsevaions, between April
1980 and March 1981. Systematic observations
were also conducted three days monthly on group
III, which ranged in Kichanga (Figure 12.2)
between August 1980 and March 1981.
The monkeys were followed from dawn (0615-
0700 h) unil dusk (1830-1900 h) during the
observaion periods. The behaviour of all visible
individuals was recorded for a 5-minute period
every 15 minutes. Data collection procedures
ensured that no less than three-quarters of all
group members were sampled once every hour,
providing adequate representatio� of the group
during each independent hourly record for
statisical analyses. The plant species and plant
___... -,
-
. --- - - - Footp.th5
-·
. Forest Reseve bounday
-coastal line 4 ..
............... Mangrove limit
Mangroves
o
Wells
0 I Km
-
Figure
12.2.
Map showing the study sites. Main study sites
(),
Jozani Forest Reserve and Kichanga. Opportunisic study
sites (II), Pete, Muungwi and Muungoni. The shaded area
(III) is the intensive study site. East-west ransects
DINOPQRST are shown at
SOOm
intervals, and one north-
south ransect.
part, here referred to as item being fe d upon by
each focal animal, was recorded whenever visible.
Food item categories were similar to those used
by Struhsaker (1975) and Marsh (1978a, 198la).
The map location of the group was noted every 15
mm.
Total systematic study imes per group were
660, 648 and 264 h for groups I, II and III,
respectively. The remaining data came from ad
libitum observation of the study groups, as well as
Search WWH ::

Custom Search