Biology Reference
In-Depth Information
Intravenous Bolus Dose
A schematic of a two-compartment model with first-order elimination is shown in
Figure 6.8
. The diazinon plasma concentration vs. time after an iv dose is represented
by this two-compartment model (
Wu et al., 1996
). The concentration of chemical in
plasma after an intravenous bolus dose as a function of time can be expressed as the
sum of two monoexponential terms,
−
α
t
−
β
.
t
C
=
A
+
B
(50)
t
e
e
At some point after dosing, the distribution phase is complete and the only process
that contributes to removal of the chemical from plasma is elimination. During this
time, Eq. (50) reduces to:
−
β
,
t
C
=
B
(51)
t
e
where
B
is the intercept and β is the slope of the
terminal
phase of the log|
C
t
vs.
t
curve (
Figure 6.9
). The rate constant β is analogous to
k
e
in the one-compartmental
model described earlier. The elimination half-life is estimated from β according to the
equation:
0 693
.
.
(52)
=
t
1 2
/
β
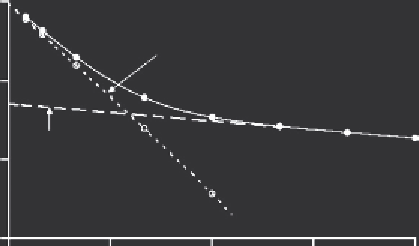
The method of residuals is used to estimate
A
and α (
Figure 6.9
and
Table 6.2
).
The initial concentration,
C
0
, is determined by substituting
t
0 into Eq. (50):
C
0
= +
.
A
B
(53)
10
C(t) = Ae
-
α
t
+Be
-
β
t
y-intercept = A
slope = -
α
/2.303
1
y-intercept = B
slope = -
β
/2.303
0.1
0.01
0
6
12
Time
18
24
Figure 6.9
Estimation of volume of
A, B,
α
, and
β
for the two-compartment model in
Figure 6.10
by
graphical methods (i.e., curve stripping). Data are shown in Table 6.2.

Search WWH ::

Custom Search