Biology Reference
In-Depth Information
k
a
k
e
10
Volume =
Vd
Dose
y-intercept = k
a
FDose/Vd(k
a
-k
e
)
1
slope = -k
e
/2.303
0.1
slope = -k
a
/2.303
0.01
0
6
12
Time (h)
18
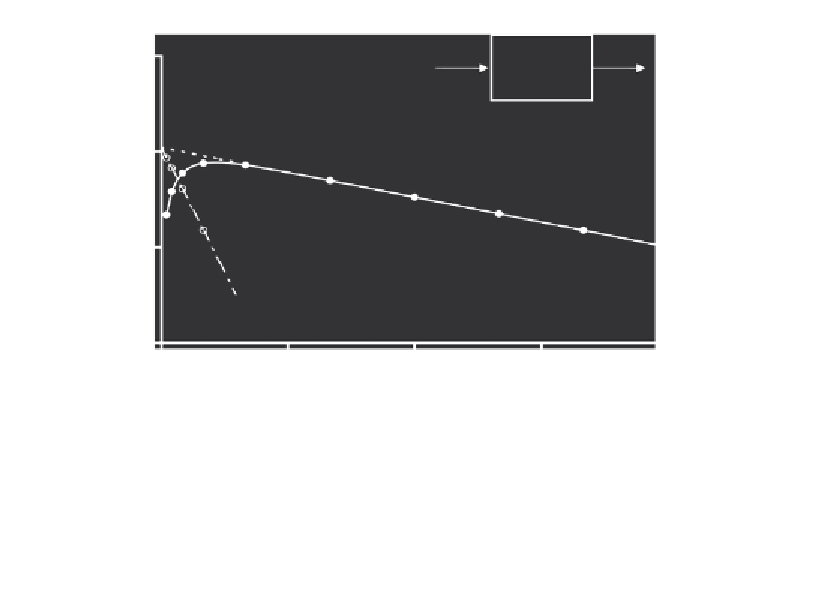
Figure 6.6
Estimation of volume of distribution and absorption and elimination rate constants for
the one-compartment model in
Figure 6.5
by graphical methods (i.e., curve stripping). Data are
shown in Table 6.1.
Table 6.1
Data Used for the Method of Residuals Example Shown in Figure 6.6
Extrapolated concentration
(mg/L plasma)
Time (h)
Plasma
Residual
0.25
0.218
1.083
0.865
0.5
0.382
1.057
0.675
1
0.597
1.005
0.408
2
0.759
0.910
0.151
4
0.724
8
0.499
12
0.334
16
0.224
20
0.150
24
0.101
Storage with Repeated Exposures
Repeated exposure to a chemical at constant time intervals may lead to accumulation
of the chemical in the body until a steady state is achieved. During any exposure inter-
val τ at steady state, the rate of chemical entry into the body is equal to the rate of its
elimination (i.e., amount absorbed equals amount eliminated).
Wagner (1967)
proposed
the concept of a concentration index (
R
C
), which provides information with regard to
the increased accumulation over multiple exposures.
R
C
is defined as the ratio of the

Search WWH ::

Custom Search