Biology Reference
In-Depth Information
k
a
k
e
Central
compartment,
volume = Vd
Extravascular
dose
10
100
8
10
6
1
4
0.1
2
0
0.00
Time
Time
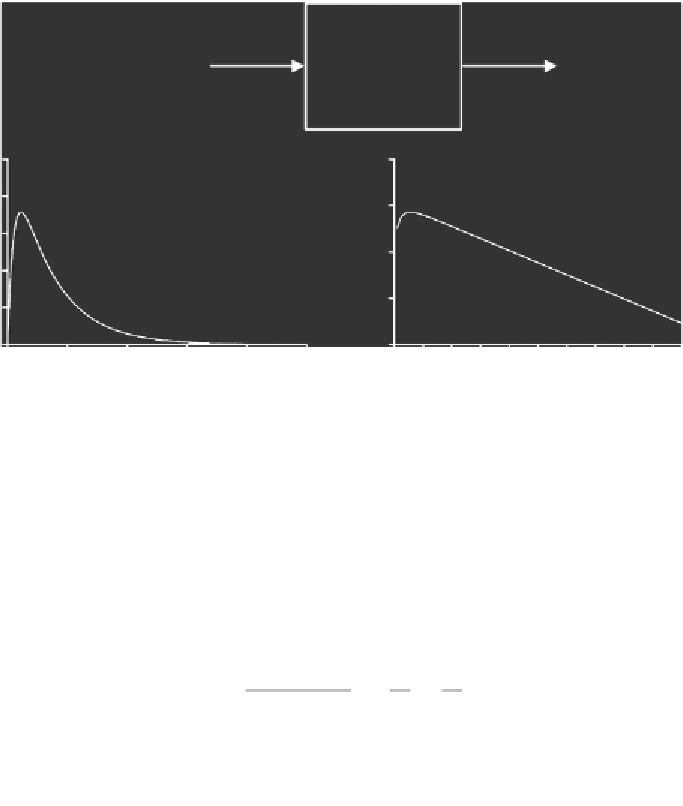
Figure 6.5
Representation of a one-compartment model with first-order absorption (i.e., extravascu-
lar administration) and first-order elimination, including a typical plasma concentration vs. time pro-
file (linear and logarithmic scales).
The post-absorption phase of the graph of log
C
t
vs.
t
has a slope of 2
k
e
/2.303, and as
in the case of a one-compartment model with an intravenous dose,
k
e
can be determined
from its terminal slope (
Figure 6.6
). The absorption rate constant may be obtained from
the
y
intercept of the plasma concentration vs. time graph, which is
k
a
FD
/(
V
d
(
k
a
k
e
)),
or by the method of residuals as shown in the example in
Figure 6.6
and
Table 6.1
.
Integration of Eq. (34) from time 0 to infinity yields:
−
k FD
V k
1
1
a
AUC
,
=
−
(35)
(
−
k
)
k
k
d
a
e
e
a
which reduces to:
FD
V k
AUC
.
=
(36)
d e
Cl and
V
d
are derived from Eqs. (26) and (27), in which dose is adjusted for
bioavailability:
FD
AUC
,
Cl =
(37)
FD
AUC k
V
=
.
(38)
d
×
e


Search WWH ::

Custom Search