Graphics Reference
In-Depth Information
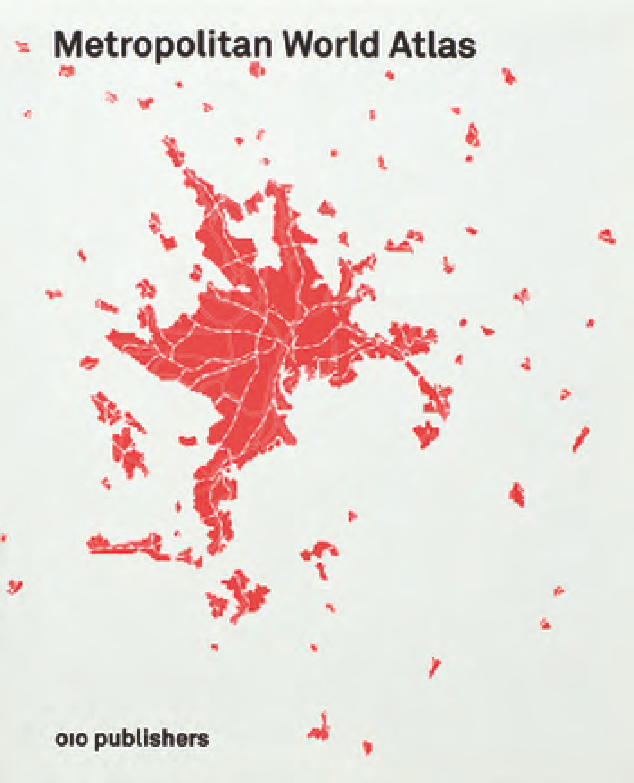
10-35 and 10-36
The cover and back
cover set the stage for
an approach to design
used throughout the
atlas: convey content
elegantly by being clear,
consistent, simple, and
direct.
CASE STUDY
Information design:
Metropolitan World Atlas
Ingenious, brave, impressive, and absolutely
unique—these are terms often used to
describe the work of graphic designer Joost
Grootens. His topics on subjects of art,
architecture, and urban spaces all share an
analytical and intelligent approach to the
subject matter.
Prior to Grootens's design of the
Metropolitan World Atlas
, there had been
no way of directly comparing worldwide
metropolises. Written by Arjen van Susteren
and published by 010 Publishers, this
remarkable atlas offers a unique survey of
global trade networks and their impact on
metropolitan spaces.
This book documents a total of 101
metropolises, analyzing them in easy-to-read
ground plans. The atlas redefines cities as
more than densely built-up areas. It chooses
to define metropolitan areas as “regions where
global relationships dominate over local ones
and which are characterized spatially by a
high concentration of global connections
and a high concentration of people.” These
areas having a global range of influence are
compared via information graphics in terms
of population, density, pollution, travel time,
data traffic, air and water travel, and the size
of central business districts, among other
pertinent factors.
The unexpected combination of
ground plans and statistics makes this atlas
a unique reference work where for the first
time metropolitan areas like Beijing, Lagos,
London, Los Angeles, Rio de Janeiro, and
Tokyo can be compared with one another in
terms of their position in the global urban
network. The atlas conveys this information
with transparent clarity, enabling readers to
sense instinctively that they are immersed in
the language of cities.
10-35
10-37
The topic's endsheets show maps of
the globe. The geographic locations of the 101
metropolitan areas are shown together with the
page numbers of where they are located in the
atlas. The color orange indicates the most populous
regions.