Information Technology Reference
In-Depth Information
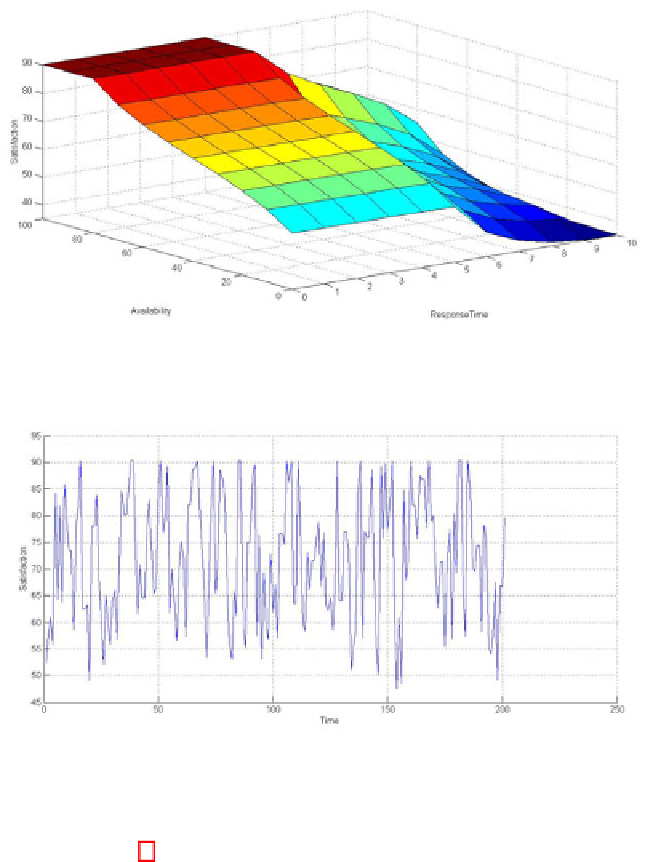
Fig. 4.
The output of satisfaction degree according to ResponseTime and Availability
membership function
Fig. 5.
Satisfaction degree
response-time of 3.67 seconds and availability of 68.6% result a satisfaction de-
gree of 82.8. Figure 4 shows a surface map for the system and the dependency
of the satisfaction degree on the response-time and availability.
We evaluate the effectiveness of the fuzzy approach with a non-fuzzy approach
with respect to the stability of the system in terms of number of times a service
needs to be replaced. The fuzzy approach performs the adaptation based on the
QoS satisfaction. Only if the result of the satisfaction is lower than a threshold
a service replacement occurs. While in the non-fuzzy approach, the replacement
decision is done based on the precise evaluation of the QoS value ranges. We
have conducted our experiment 200 times, each time providing random data for
the input parameters. Figure 5 illustrates the output (satisfaction degree) of the
experiment. The satisfaction threshold was set to 70%.
Figure 6 represents the stability of the fuzzy and non-fuzzy systems. As it
is shown, the number of service replacement in a non-fuzzy approach is much