Information Technology Reference
In-Depth Information
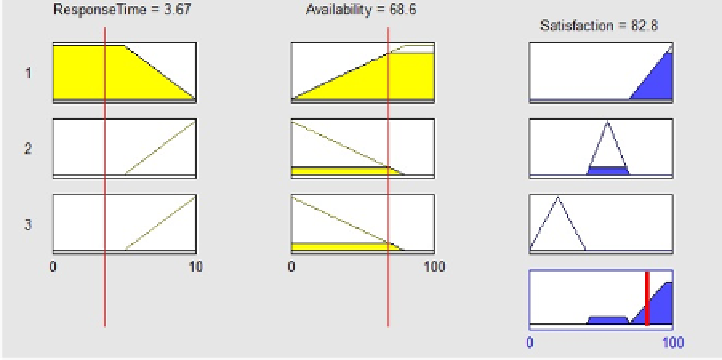
6 Experiments and Implementation
Having defined the membership functions and rules in the previous sections,
we have built and simulated a fuzzy inference system to interpret rules. The
process has different steps including: fuzzification of input quality parameters,
applying fuzzy operators to the antecedent, implication from the antecedent to
the consequent, aggregation of the results for each rule, and defuzzification. A
view of the simulator including the previous steps is illustrated in Figure 3 in
which a complete fuzzy inference system is represented.
The first step is to apply the membership functions to map each QoS param-
eters to the appropriate fuzzy set (between 0 and 1). We used two inputs of
Availability (interval between 0 to 100) and Response-time (interval between 0
to 10). The inputs are mapped to fuzzy linguistic sets: availability is compatible,
availability is incompatible, response-time is compatible, and response-time is
incompatible. Figures 1 and 2 show to what extent the availability and response-
time are compatible. The next step is to give the result of the fuzzified input
parameters to the fuzzy operators. According to the rules, AND and OR oper-
ators are applicable. This will give us a degree of support for each rule. Next
is applying the implication method that uses the degree of support to calculate
the output fuzzy set. We used a
minimum
method to truncate the output fuzzy
set for all the rules separately. However, we apply all the rules in parallel and
we do not define any priority and weight for them.
At the end of the implication, we apply an aggregation method to combine all
the rules. This way, the outputs of each rule represented in fuzzy sets are com-
bined into a single fuzzy set. A maximum method is used for the aggregation.
The last step is to defuzzify the fuzzy set resulted after the aggregation step.
We applied a
centroid
method to calculate the defuzzification process. The
method returns the center of the area under the curve. Figure 3 shows that the
Fig. 3.
A view of the simulator for fuzzy inference system