Database Reference
In-Depth Information
How it works…
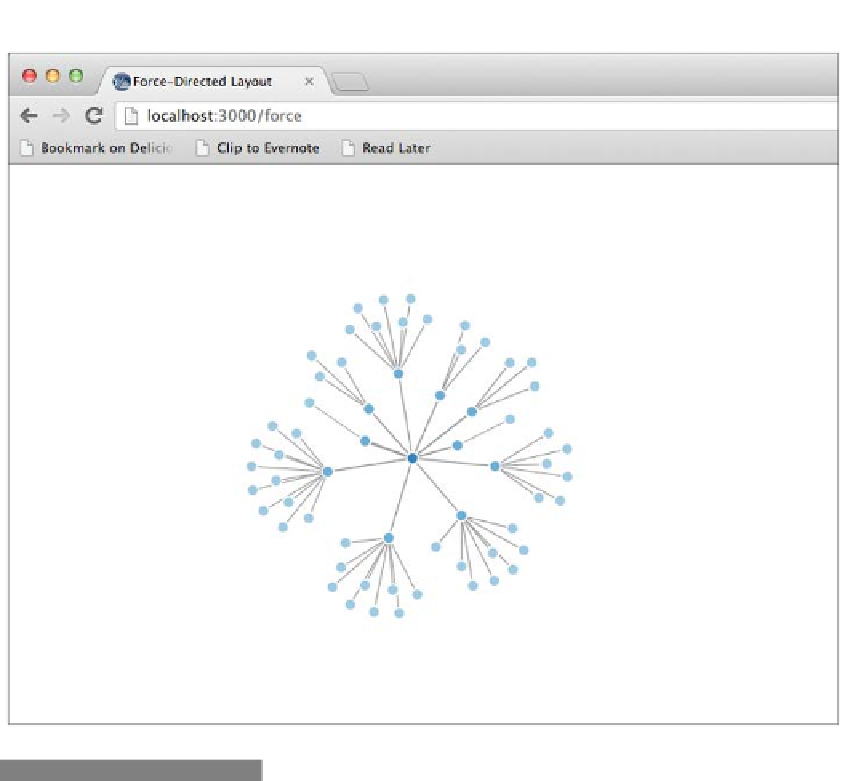
This is a good example of a pure D3 visualization, without NVD3. We've broken the task up
into functions to make them easier to understand, but let's take a look at the typical D3
visualization process that we outlined at the end of the
Creating time series charts with D3
recipe and see how the functions in this recipe it into it, as follows:
1.
Create the chart:
create-force
takes care of creating the controller for the chart.
2.
Call select on the container:
create-svg
selects the SVG elements to render
the graph.
3.
Call selectAll on the element we want created to contain each data point:
Two functions,
create-links
and
create-nodes
, start by calling
selectAll
on line nodes and circle nodes.