Database Reference
In-Depth Information
This line adds the
class
attribute with the value
line
. We used this in the CSS style sheet to
set the line's color:
(attr "d" line)))
This sets the
d
attribute to be the value of the
line
function called on this element's datum.
The
line
function is created by
get-line
, and it knows how to get its coordinates from the
data's
date
and
close
properties.
There's more…
The Mozilla Developer Network has a good reference to SVG at
https://developer.
Visualizing graphs with force-directed
layouts
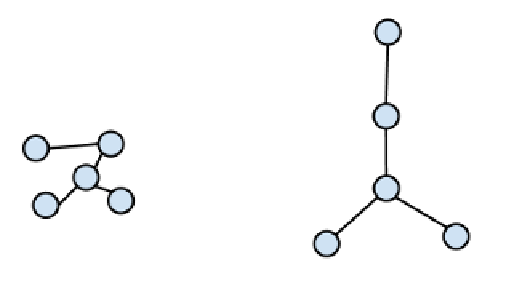
One popular way to visualize graphs of data is to use a force-directed layout. This employs
a physical simulation of charged particles and springs to create an aesthetically pleasing
visualization. It minimizes crossed lines while keeping all the edges more or less of the
same length. This makes the relationships in the graph immediately clear, at the expense of
expressing the distances between nodes. For example, consider the following diagram. On the
left, we have a graph that is randomly laid out. On the right, it's laid out using a force-directed
layout. Each of the edges is approximately as long as the others, and each node is as far away
from its neighbors as it can get:
In this recipe, we'll create a force-directed graph visualization for a K-Means cluster of the US
census race data aggregated by state.