Database Reference
In-Depth Information
8.
Actually, pulling all of this together is pretty simple:
(defn ^:export scatter-plot []
(webviz/create-chart
"/scatter/data.json"
"#scatter svg"
make-chart
(partial ->nv-data "Racial Data")
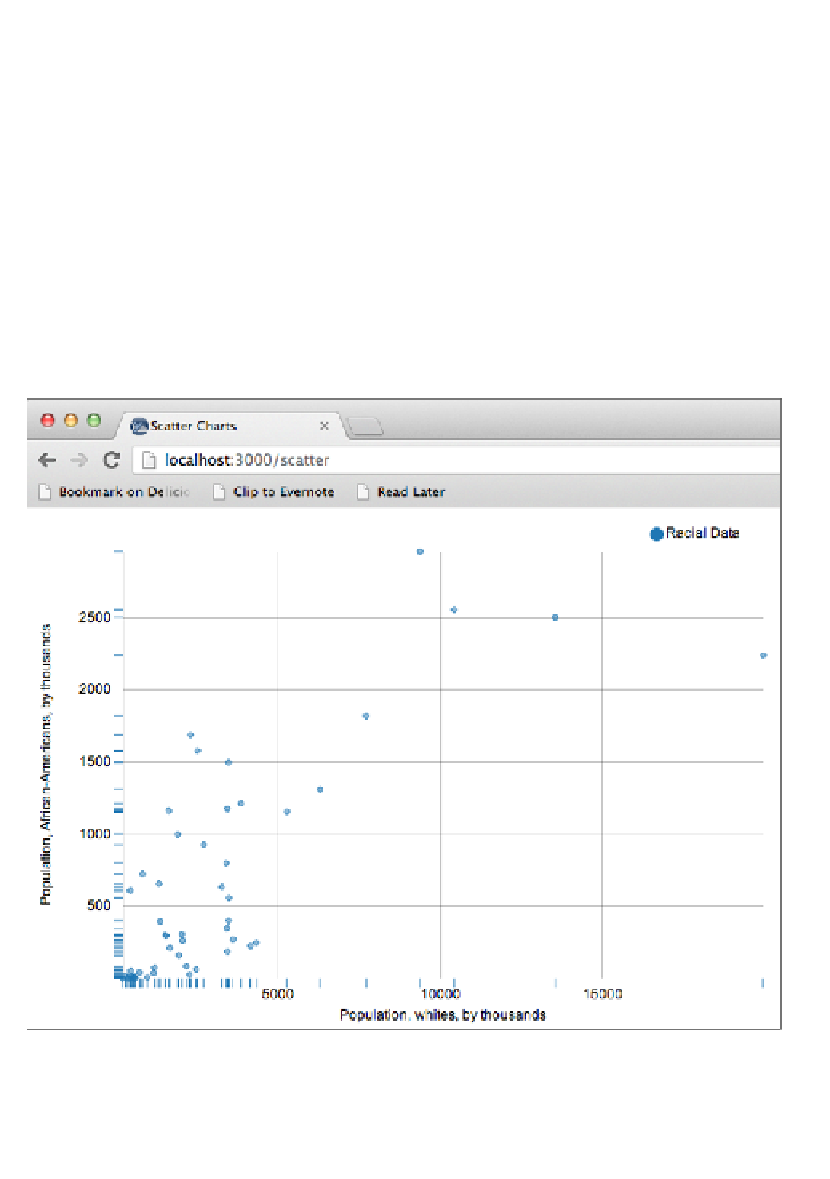
:x-label "Population, whites, by thousands"
:y-label (str "Population, African-Americans, "
"by thousands")
:transition true))
as shown in the following screenshot: