Database Reference
In-Depth Information
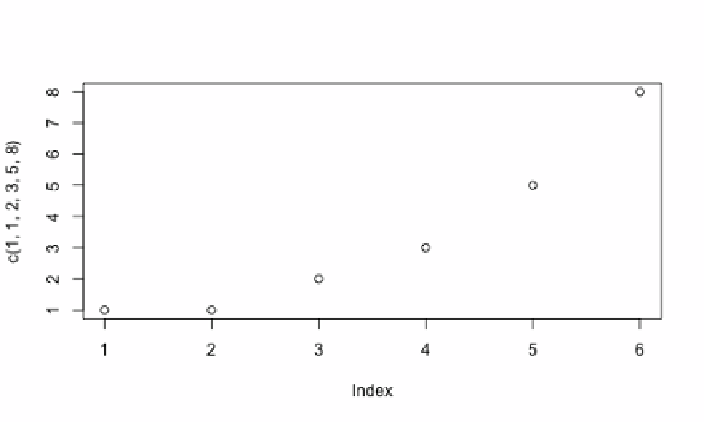
If we open up the
fib.png
ile and take a look at it, we can see the results of the
simple graphing call that we made, as shown here:
How it works…
The body of this function is in the string that gets passed to R to evaluate. It's composed of
three function calls. First, it initializes the PNG output with the
png
function:
"png(filename=\""
(.getAbsolutePath (File. filename))
"\", height=300, width=500, bg=\"white\")\n"
Then, we actually plot the data:
"plot(" (->r data) ")\n"
Finally, save the plot to the ile:
"dev.off()\n"
There's more…
A scatterplot is a very basic plot, which Incanter can do as well. However, R's graphing features
are more sophisticated than what Incanter can currently do. To get a taste of what R's capable