Database Reference
In-Depth Information
4.
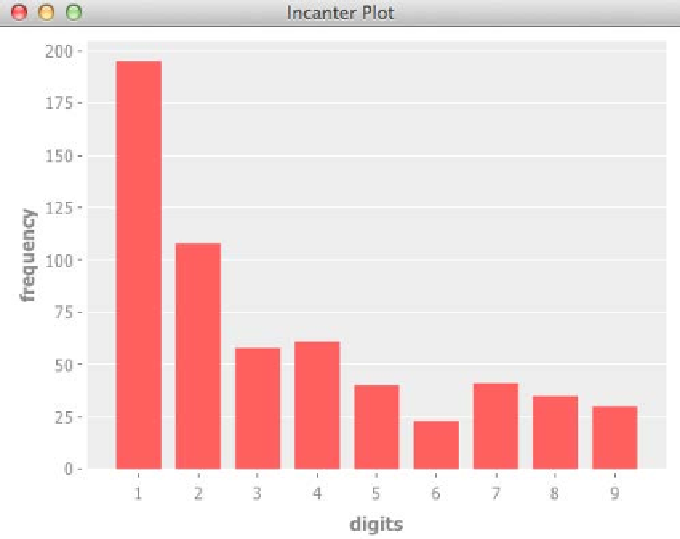
A histogram can help us visualize the distribution of the digits:
(def chart
(let [digits (map inc (:row-levels bt))
frequency (:table bt)]
(doto (c/bar-chart digits frequency)
(i/view))))
So the graphed distribution appears to naturally follow Benford's law.
How it works…
Benford's law states that the initial digits in a naturally occurring dataset should display a
logarithmic probability.
The function
benford-test
calculates the frequencies of the initial digits from the input
and performs a
Χ²
test, based upon the frequencies expected by Benford's law.