Information Technology Reference
In-Depth Information
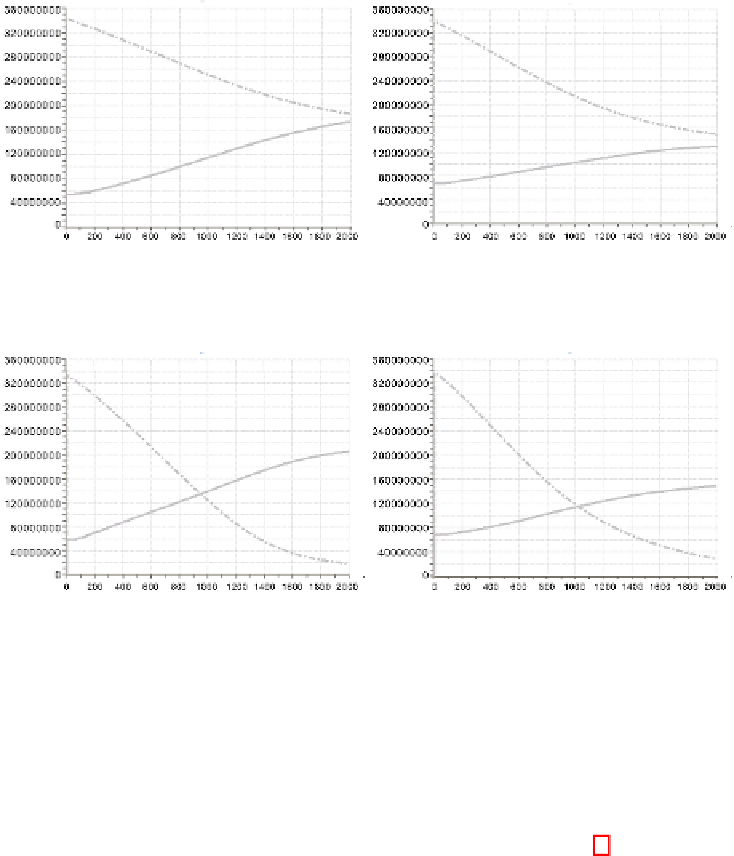
Fig. 5.
System's Sharing vs Demand, Population 1 (left) and Population 2 (right). Coalitions.
Bytes vs Time, solid line represents the offer and dotted-dashed the demand.
Fig. 6.
System's Sharing vs Demand, Population 1 (left) and Population 2 (right). No Coalitions.
Bytes vs Time, solid line represents the offer and dotted-dashed the demand.
which only share if they have outstanding downloads. On the other hand, the demand
is not negatively affected by the decrease of the offer in Population 2, it is even better.
The initial demand is similar, but the result is 10% better (demand is 10% lower) in
Population 2. Once again it is shown that Adaptive users benefit the whole System
when using the Coalition algorithm.
When analysing the sharing and demand in No Coalitions, Figure 6, we found that
the offer behaves similarly to Coalitions; adaptive users cause a reduction of the slope
of the offer. This is common to all the algorithms, and it justifies that some of them
decrease the total amount of downloaded bytes. However, the demand seems not to be
affected by adaptive users, that is to say, the introduction of adaptive users does not
benefit the system when using this algorithm.
Comparing algorithms, seems that No Coalitions manage to get a better results. How-
ever, the reason for the fall of the demand on Coalitions is because the detection of Free
Riders. Numerically, The Coalitions algorithm in Population 1 reaches 54% of Work
Progress and in Population 2 44%, considering that Free Riders are 50% in Population
1 and 40% in Population 2, and subtracting their demands, the work progress is near
to 4% to finishing in both populations. There is a proportional relationship between
population size and demand.