Information Technology Reference
In-Depth Information
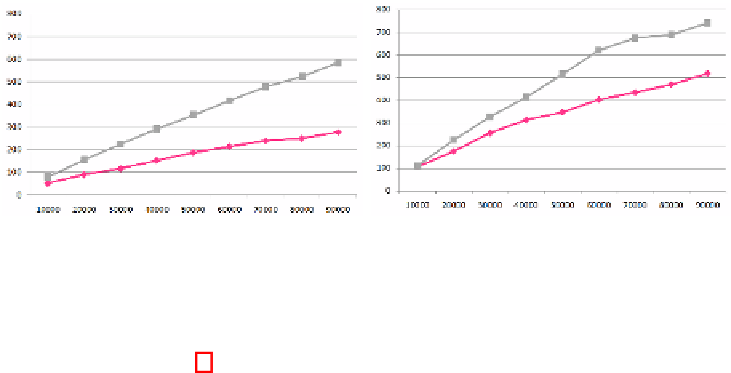
Fig. 4.
Average Download Time (Time vs Bytes), Population 1 (left) and Population 2 (right)
Average Time.
In addition to the total amount of bytes downloaded during the sim-
ulation, the time spent on each download is also a significant measure of the system
performance. In Figure 4 the average time for each file for both algorithms is compared
(squares for No coalitions and diamonds for Coalitions).
Population 1: When Adaptive users are not considered, Figure 4 left, the best down-
load times are the ones obtained with Coalitions. For the smallest files, the times for No
Coalitions and Coalitions are quite similar then, the higher the file size is, the greater
the time difference. As expected, the benefit of using Coalition is increased as the file
sizes grows.
Population 2: When Adaptive users are introduced average download time is in-
creased, this is because the system is more stressed. Adaptive users implement a selfish
behaviour, but they have to share in order to obtain benefits and they are capable of
simultaneous downloads. All of this increases the download time. In Figure 4 right No
Coalitions and Coalitions show a very similar slope and smaller values for Coalition
mechanism, which also stops Free Riders. In this way, the system benefits without pe-
nalizing user's downloading times.
Work Progress.
Our simulations have been modelled with a final objective, this is, that
every node stores the whole file collection available in the system. Work progress allows
us to study how the different configurations satisfy this final objective. In addition, it
helps us to analyse the difference between the two different populations used in the ex-
periment. To study the evolution of the Work Progress we have monitored the evolution
of the bytes shared and the bytes demanded. As in economic equilibrium these lines are
crossed, meaning that the supply and the demand are balanced. This is an indication of
the System's health.
Figure 5 shows the sharing and demand for Coalitions in the two studied populations.
The offer, initial stored files in the system is slightly bigger for the second population,
this is observed where the offer (solid line) crosses the Y axis. This is due to the decrease
in the number of Free Riders in Population 2,which justifies what was introduced in
section 4.2, the experiments run with Population 2 get a smaller number of downloaded
bytes.
Note that the evolution of the offer and the demand are significantly different when
Adaptive users are introduced (population 2). On one hand, the slope of the offer is
much smaller on Population 2, this is because of the sharing policy of Adaptive users,