Information Technology Reference
In-Depth Information
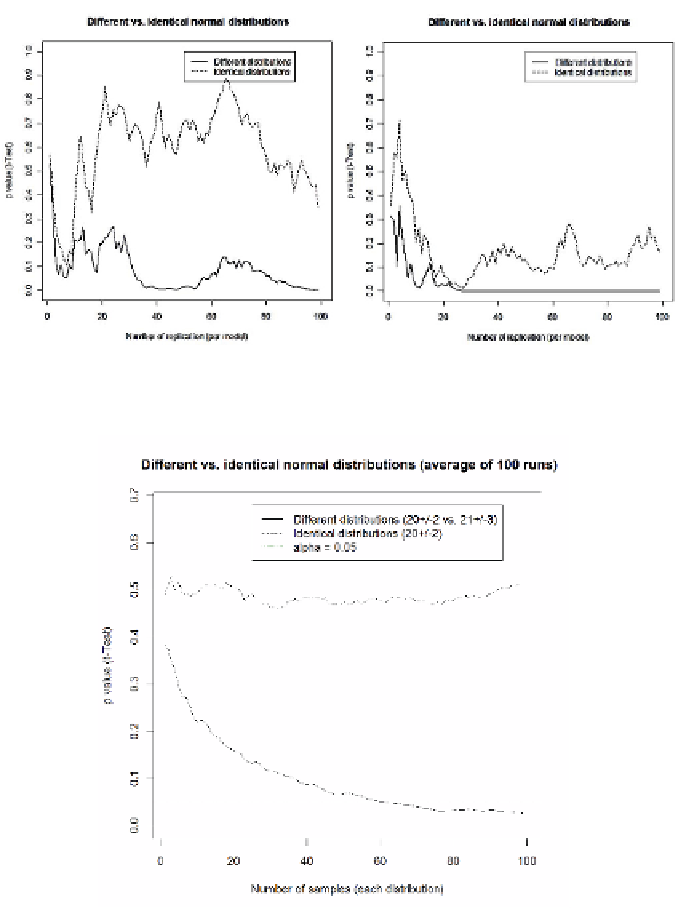
Fig. 2.
Two examples for p values of t-test development for growing number of samples (normal
distributions with mean 20, stdev 2 vs. mean 21, stdev 3)
Fig. 3.
p value of t-test development for growing number of samples (normal distributions with
mean 20, stdev 2 vs. mean 21, stdev 3 - Average of 100 runs
(dashed red line) are close by 0.5 while the p values of the different distributions (solid
blue line) move towards the x-axis.
In this study, we focus on the comparisons of two different distributions and leave out
the single sample case where only one measurement variable of one variant is taken into
account. The following two sections describe two approaches to significance estimation.