Graphics Reference
In-Depth Information
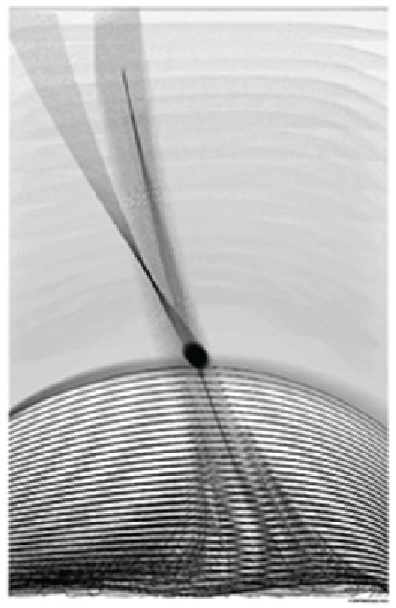
Figure 7. Anna Melkumian, “The Drop” is a visual
response to a sound (© 2006, A. Melkumian. Used
with permission)
2007). Recent trends in social and collaborative
software have greatly increased the popularity of
this type of visualization. Common approaches to
the tag cloud visualization design give consider-
ation to the large whitespaces, overlapping tags,
and restriction to specific boundaries. The tag
cloud layouts computed by algorithms that address
these issues (Seifert, Kump, Kienreich, Granitzer,
& Granitzer, 2008) are compact and clear, have
small whitespaces, may feature arbitrary convex
polygons as boundaries, and thus are useful for
many application scenarios.
4. MUSIC VISUALIZATION
Visualization, in accordance with a name, usually
relates to a visual form, however there may be
other sensory representations. Examples of the
non-visual creations are multimodal interactive
data presentations (such as user interfaces that can
be realized in visual, auditory, or tactile domains),
sonification (such as sonification of atmospheric
events or human motion), and haptic/touch inter-
faces (for example, pressure sensitive interfaces).
For example, Noritaka Osawa (2004) proposed an
auditory method that generates sound passages
called “sound glyphs” (depicted in the form of
notes) for nodes in hierarchical relationships or
constraints. Different nodes at the same depth in
this hierarchy are distinguished by melodies. We
may find a pervasive use of metaphors in literature,
visual arts, and music.
For example, one can envision a continuum
encompassing sound qualities: silence, sound,
and noise, represented as a grayscale, where white
stands for silence, grey for a sound and black for
noise. In a project that was a warm-up for the
information visualization class projects students
were asked to reserve color white for silence, grey
for sound, and black for noise. One example of
this can be seen in Figure 7.
Many believe that metaphors in music theory
inform and shape the ways we think about music so
musical analyses are not scientific but metaphori-
cal explanations. When one talks about rhythm,
timing and tempo, often an analogy with physical
motion (like walking or moving) is made.
Student artwork entitled “Two Directions for
Two Trombones” is another example of visualiza-
tion with the use of the visual thinking technique.
It is a visual guide for playing music: it visual-
izes directions for playing a trombone by two
people, visually presenting pitch and volume in
this performance. The two directions are written
on the graph as: change pitch and change volume
(Figure 8).