Graphics Programs Reference
In-Depth Information
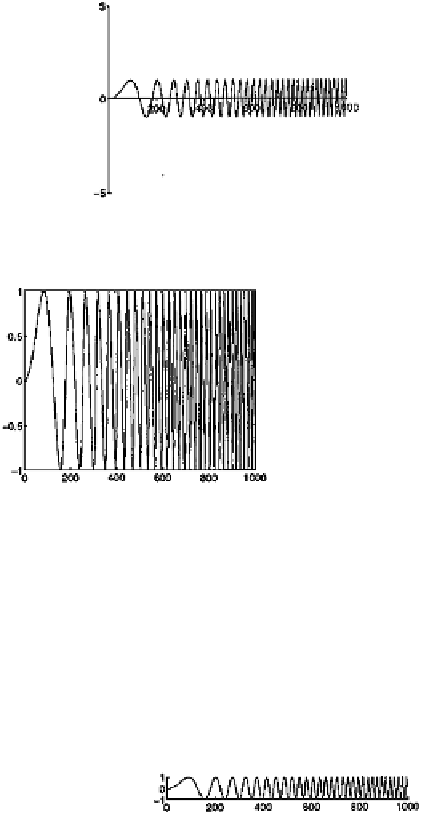
x = linspace(-1,1,8192);
Fs = 1000;
y = vco(x,[0 500],Fs);
plot(y(1:1000))
axis([0 1000 -5 5])
zeroaxes
We used the
axis
command to set the
y
-axis limits to
[-5 5]
instead
of the default limits, in this case, of
[-1 1]
clf
plot(y(1:1000))
which makes the variation in frequency slightly less apparent, and is
just too grandiose. The eye can pick up very subtle variations in line
straightness, but here the variation is so huge that the lines become
parallel and begin to produce the optical illusion of vibration. Also,
lines that are very nearly vertical or horizontal begin to be affected by
the finite resolution of dot printers. Using Handle Graphics we can
achieve a more elegant result by reducing the height of the
y
-axis. We
do this by setting the
position
property of the current axes:
set(gca,'Position',[.1 .5 .8 .1],'box','off')
The
gca
input is itself a function, which returns the handle to the current
set of axes. We are saying that we want to set the position of the current
axes to be equal to the vector
[.1 .1 .8 .1]
. The position vector has
the form
[
left
,
bottom
,
width
,
height
]
, in units normalised to the
figure window; (0
,
0) is the bottom left and (1
,
1) is the top right. But
perhaps we should shrink it even further, and dispense with the ever-
present axes:
set(gca,'Position',[.1 .5 .8 .01],'visible','off')