Graphics Programs Reference
In-Depth Information
-0.5000
-0.3750
-0.2500
-0.1250
0
0.1250
0.2500
0.3750
We combine
fftshift
and
fftfreq
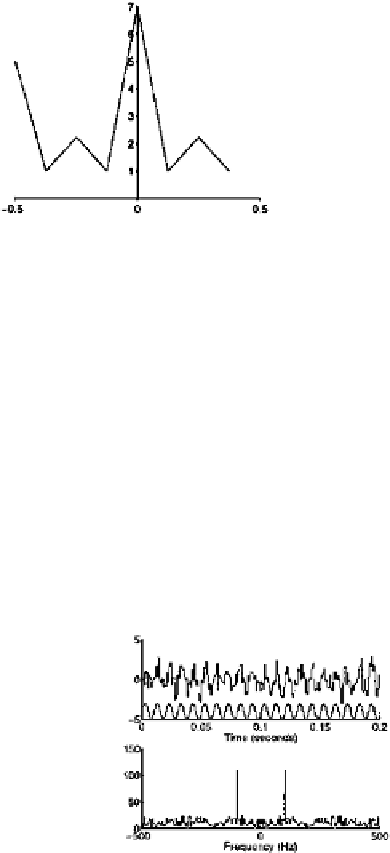
to plot the two-sided FFT:
plot(fftfreq(.5,8),fftshift(abs(Y)))
axis([-.5 .5 0 7])
zeroaxes
Let us do a slightly more realistic example. We simulate some data
recorded at a sampling frequency of 1 kHz, corresponding to a time step
dt = 1/1000
of a second. The Nyquist frequency is, therefore, 500 Hz.
Suppose there is a 100 Hz sinusoid contaminated by noise. We simulate
the data, calculate the FFT, and plot the results as follows:
dt = 1/1000;
t = dt:dt:200*dt;
sine = sin(2*pi*100*t);
y = sine + randn(size(t));
Y = fft(y);
f = fftfreq(500,length(Y));
clf
subplot(211)
stairs(t,y)
hold on
stairs(t,sine-4)
box
xlabel('Time (seconds)')
subplot(212)
stairs(f,fftshift(abs(Y)))
box
xlabel('Frequency (Hz)')