Graphics Programs Reference
In-Depth Information
>> z = 5*ones(3,3)
z=
5
6
5
5
5.5
5
5
5
5
5
5
5
4.5
>> surf(x,y,z)
4
1
2
1
0
0
−1
But, of course, the
z
values need not be constant:
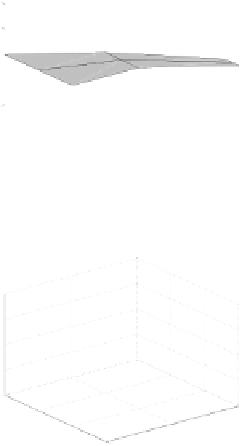
>> z = [[4; 5; 6] [4.5; 5; 5.5] [4.9; 5; 5.1]]
z=
4.0
4.5
4.9
5.0
5.0
5.0
6
6.0
5.5
5.1
5.5
>> surf(x,y,z)
5
4.5
4
1
2
0
1
0
−1
Other graphics functions can also handle nonrectangular grids. Here is
an example using the
contour
function:
3
5
.8
2.5
5
.6
cs = contour(x,y,z,'k');
clabel(cs)
i=[1479631];
hold on
plt(x(i),y(i),':')
2
5
5
.4
4
.8
1.5
5
.2
4
.4
4.2
1
4
.6
0.5
0
−1
−0.5
0
0.5
1
The contour levels are labelled using the
clabel
command, and the
region defined by the
x
and
y
points is outlined by the dotted line. The
contours that the labels refer to are marked by small plus signs '
+
'. The
outline around the bent domain is drawn using the
x
and
y
matrices
indexed using the vector
i
. The vector
i
extracts the appropriate points
from the
x
and
y
matrices using the columnar indexing described in sec-
tion 3.4 on page 9. The other surface graphics functions—
mesh
,
surfl
,
surfc
, and
contourf
—can handle such nonrectangular grids equally
well. The
image
and
imagesc
functions assume equally spaced rect-
angular grids and cannot handle anything else. (The
pcolor
function
draws a surface and sets the view point to directly overhead, so it is not
discussed separately.)
Let us now do another example of a surface defined over a non-
rectangular grid. We want to define a set of points that cover the semi-