Graphics Programs Reference
In-Depth Information
The conclusion is that most viewers find it very diQcult to interpret
these sorts of images; the cognitive switch from, for example, royg-
biv to amplitude is very slow and nonintuitive. A way out of this is
to use a palette of slightly varying, nonsaturated colours. These sorts
of colours have been used to create high-quality geographic maps for
many years. Most of matlab's colour maps consist of highly saturated
colours (including the default colour map, which is
jet(64)
). It is bet-
ter to forgo these sorts of colour maps and stick with the calmer ones
such as
gray
,
bone
,or
summer
. The
gray
colour map has the added
advantage that printed versions will reproduce easily, for example, on a
photocopier.
2
The companion m-files include some other colour maps:
redblue
,
myjet
,
yellow
,
green
,
red
, and
blue
.
To distinguish adjacent patches of subtly different colours, the eye
can be helped by enclosing the patches with a thin dark edge. The
contourf
function, therefore, is an excellent way of displaying this sort
of data.
3
7.5 Extracting Logical Domains
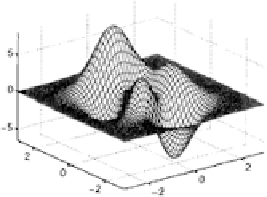
Let us look again at the peaks function:
[x,y,z] = peaks;
surfl(x,y,z)
axis tight
colormap(gray(64))
Suppose we want to extract the part of this surface for which the
z
values
lie between 2 and 4. We use exactly the same technique as was given
on page 23. The
find
command is used first to find the indices of the
z
values that satisfy the logical test:
>> ind = find(2<=z & z<=4);
>> size(ind)
ans =
234
1
There are 234 elements in
z
that satisfy our condition. We can plot these
elements over the surface as
follows:
2
Edward R. Tufte,
Visual Explanations
(Graphics Press, Cheshire Connecticut,
1997), pp. 76-77.
3
Edward R. Tufte,
Envisioning Information
(Graphics Press, Cheshire Connecti-
cut, 1990), pp. 88ff.