Graphics Programs Reference
In-Depth Information
We can plot the surface
z
as a function of
x
and
y
:
mesh(x,y,z)
We can expand the domain of the calculation by increasing the input
to
meshgrid
. Be careful to end the lines with a semicolon to avoid being
swamped with numbers:
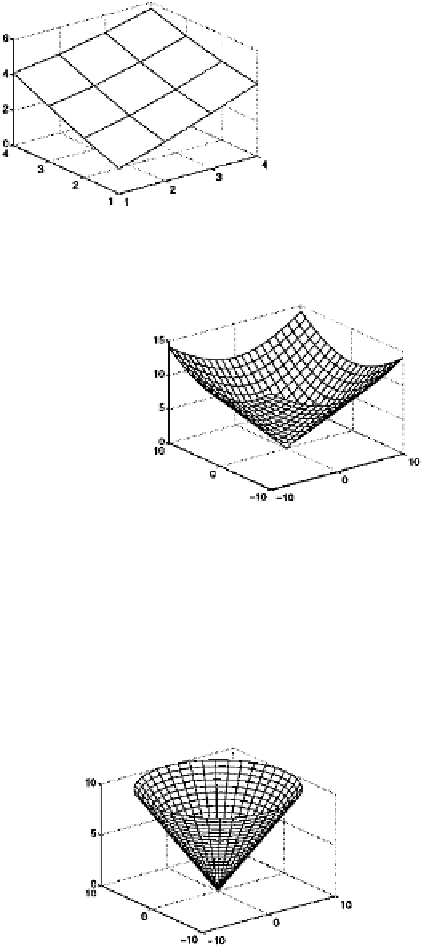
[x,y] = meshgrid(-10:10);
z = sqrt(x.^2 + y.^2);
mesh(x,y,z)
The surface is an inverted cone, with its apex at (0
,
0
,
0).
Companion M-Files Feature 3
A clearer plot can be produced
using a polar grid, instead of a rectilinear grid. We can use the
companion function
polarmesh
to produce such a plot. First we
define a polar grid of points:
[r,th] = meshgrid(0:.5:10,0:pi/20:2*pi);
Then display the surface defined by z
=
r:
polarmesh(r,th,r)
A more interesting surface is
x
)
2
e
−
x
2
−
(
y
+1)
2
y
5
)
e
−
x
2
y
2
10(
5
x
x
3
−
z
= 3(1
−
−
−
−
···
3
e
−
(
x
+1)
2
−
y
2
1
−
.
In matlab notation you could type: